NFL Week 7 Man vs Zone: Where the Shell Changes the Matchup
13 Week 7 WR matchups through man and zone splits, coverage shells and target demand, with interactive Statyx charts and detailed matchup reads.
Get the tools behind this post. Free Statyx account, no card needed.
Sign up free Kaz

By Kaz · October 22, 2026 · 2026 regular season through Week 6
CIN’s Cover 1 has conceded 8.16 Yds per target. KC’s has allowed 3.77. Flowers and JSN both earn plenty of targets against man, but those two defenses are asking very different questions. That is where this week’s receiving matchups get interesting.
The same applies to zone. PHI has allowed 8.84 Yds per target in Cover 3 and only 3.63 in Cover 6. CeeDee Lamb gets a useful opening, but calling the whole defense soft against zone would skip half the work. Below are five man reads, five zone reads and three receiving ceilings, with the shell evidence kept alongside the player’s role.
Man readsZone readsThree ceilingsFinal boardFamily percentages describe Statyx’s opponent tendency. Shell percentages describe shell tagged targets. They are separate samples; the method is explained at the end.
Man coverage: earning the target is only half the matchup
Target demand and man efficiency can disagree
Yds per classified route. Exact route and target samples appear in each player brief.
| Matchup | Man | Zone |
|---|---|---|
| Zay Flowers | 3.758 | 4.421 |
| JSN | 1.821 | 3.752 |
| Carnell Tate | 1.765 | 2.049 |
| Burden | 2.05 | 2.2 |
| Nico Collins | 1.567 | 2.062 |
CIN’s Cover 1 gives the matchup a proper foundation
| Team tgt share | Air Yds share | Overall YPRR |
|---|---|---|
| 31.1% | 34.4% | 3.77 |
| Type | Rts | Tgt | Rec | Yds | TPRR | YPRR |
|---|---|---|---|---|---|---|
| Man | 33 | 11 | 7 | 124 | 33.3% | 3.76 |
| Zone | 76 | 28 | 24 | 336 | 36.8% | 4.42 |
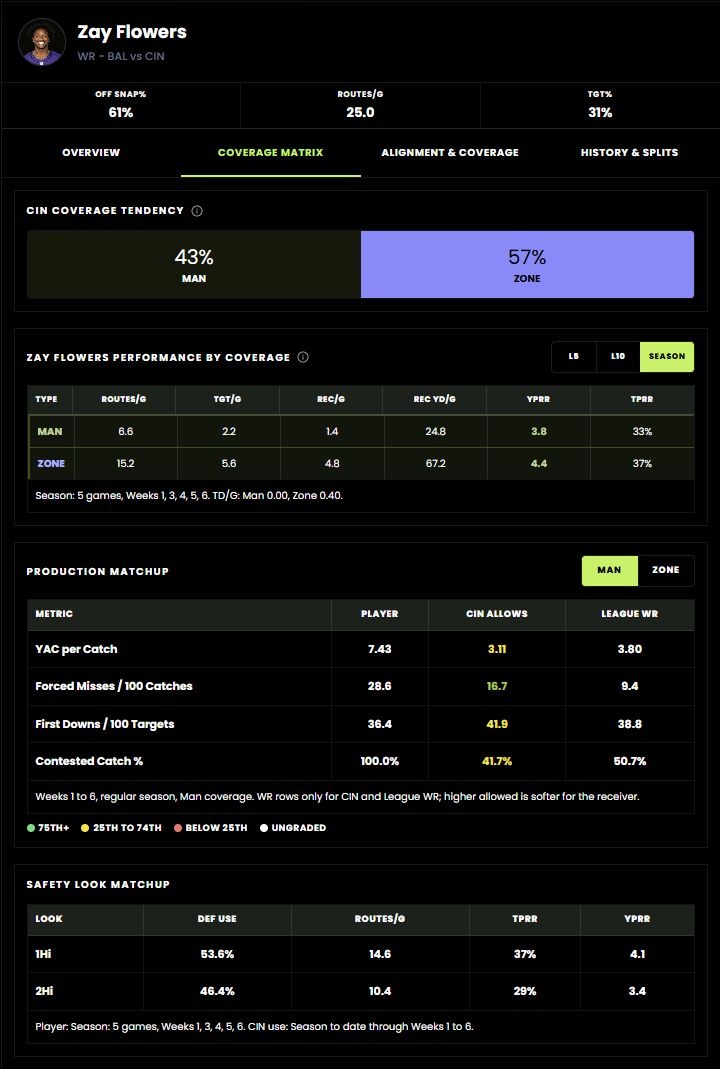
Flowers earns the ball against either family. His classified man sample contains 11 targets on 33 routes, with seven catches for 124 Yds. Against zone, 28 targets on 76 routes produced 24 catches for 336 Yds. The 33.3% man target rate is useful; the fact that his zone rate is even higher makes him less dependent on getting one preferred answer from the defense.
CIN’s opponent man rate is 43.2%. In its separate shell sample, Cover 1 has allowed 367 Yds on 45 targets, or 8.16 per target. Flowers has seven catches for 133 Yds on 11 Cover 1 targets. Cover 3 is also workable: 14 catches for 163 Yds on 16 targets, against CIN’s 6.93 Yds allowed per target. The broader role is sturdy, with 31.1% of BAL’s targets and 3.77 overall Yds per route.
The live Coverage Engine adds a second angle: Flowers has 296 Yds on 73 single high routes, with 27 targets. CIN’s separate safety look panel shows 53.6% single high. This supports the receiving mechanism without pretending a safety look and a named shell are interchangeable. Jackson was limited Wednesday with his ankle issue, so the ceiling remains tied to the quarterback situation. A game total of 49 gives the healthy version of this offense enough room to work.
| Shell | Player rec / tgt | Player YPT | DEF YPT / tgt |
|---|---|---|---|
| Cover 1 | 7 / 11 | 12.09 | 8.16 / 45 |
| Cover 3 | 14 / 16 | 10.19 | 6.93 / 42 |
| Cover 2 | 5 / 6 | 8.50 | 8.39 / 23 |
Flowers has produced against both safety looks
Yds per route. Separate safety sample: single high 27 targets / 73 routes; two high 15 / 52. This is not a shell rate.
| Matchup | Flowers |
|---|---|
| Single high | 4.055 |
| Two high | 3.365 |
The targets travel better than the man efficiency
| Team tgt share | Air Yds share | Overall YPRR |
|---|---|---|
| 35.1% | 48.4% | 3.55 |
| Type | Rts | Tgt | Rec | Yds | TPRR | YPRR |
|---|---|---|---|---|---|---|
| Man | 39 | 14 | 8 | 71 | 35.9% | 1.82 |
| Zone | 105 | 35 | 28 | 394 | 33.3% | 3.75 |
JSN has drawn 14 targets on 39 classified man routes, a 35.9% target rate. Those looks produced eight catches for 71 Yds, or 1.82 Yds per route. His zone production is much stronger at 394 Yds on 105 routes. The demand survives man coverage; the yardage has been harder to generate once the target arrives.
KC’s 43.3% opponent man rate makes that distinction relevant. Its Cover 1 has allowed only 117 Yds on 31 targets. JSN’s own Cover 1 sample is four catches for 34 Yds on 11 targets. Cover 3 offers a better route: KC allows 8.27 Yds per target, and JSN has 14 catches for 181 Yds on 17 targets against it. His 35.1% team target share keeps him central to SEA’s offense. This is a high volume receiver with a selective coverage opening, rather than an automatic explosive matchup.
| Shell | Player rec / tgt | Player YPT | DEF YPT / tgt |
|---|---|---|---|
| Cover 1 | 4 / 11 | 3.09 | 3.77 / 31 |
| Cover 3 | 14 / 17 | 10.65 | 8.27 / 52 |
| Cover 4 | 8 / 8 | 12.25 | 5.77 / 47 |
The air Yds share is loud. CLE’s shell results answer back.
| Team tgt share | Air Yds share | Overall YPRR |
|---|---|---|
| 26.7% | 50.8% | 1.95 |
| Type | Rts | Tgt | Rec | Yds | TPRR | YPRR |
|---|---|---|---|---|---|---|
| Man | 34 | 9 | 5 | 60 | 26.5% | 1.76 |
| Zone | 103 | 25 | 19 | 211 | 24.3% | 2.05 |
Tate owns 50.8% of TEN’s air Yds and a 26.7% target share. That is a serious role, but CLE is a harder opponent than the opportunity alone suggests. The Browns’ opponent man rate is 56.5%; Tate’s classified man sample is five catches for 60 Yds on nine targets across 34 routes. He has earned looks without consistently turning them into large gains.
Cover 1 accounts for 43.0% of CLE’s shell tagged targets and has allowed 6.37 Yds per target across 92 throws. Tate has four catches for 45 Yds on nine Cover 1 targets. Moving into zone does not solve everything: CLE allows 4.38 Yds per target in Cover 3 and 3.88 in Cover 4. Tate’s 12 catches for 148 Yds on 15 Cover 3 targets show he can work against it, but that production faces genuine resistance. With a 37 game total, the better read is continued involvement with a more demanding route to a ceiling.
| Shell | Player rec / tgt | Player YPT | DEF YPT / tgt |
|---|---|---|---|
| Cover 1 | 4 / 9 | 5.00 | 6.37 / 92 |
| Cover 3 | 12 / 15 | 9.87 | 4.38 / 64 |
| Cover 4 | 3 / 3 | 8.67 | 3.88 / 25 |
Thursday’s opportunity is broader than the man label
| Team tgt share | Air Yds share | Overall YPRR |
|---|---|---|
| 22.2% | 28.0% | 2.19 |
| Type | Rts | Tgt | Rec | Yds | TPRR | YPRR |
|---|---|---|---|---|---|---|
| Man | 20 | 5 | 3 | 41 | 25.0% | 2.05 |
| Zone | 110 | 29 | 21 | 242 | 26.4% | 2.20 |
Burden’s five man targets on 20 routes are too few to crown him a specialist. They produced three catches for 41 Yds. The more established zone sample contains 29 targets on 110 routes, with 21 catches for 242 Yds. His target rates are similar across the two families, and his 22.2% overall team share gives the matchup a role to build on.
NE’s opponent man rate is 45.8%, but its shell allowances point toward a more selective plan. Cover 1 has held opponents to 5.31 Yds per target, compared with 7.92 in Cover 3 and 9.15 in Cover 2. Burden has four catches for 44 Yds on five Cover 1 targets and seven for 87 on 13 Cover 3 targets. The man response is promising, while the larger sample supports finding work in zone too.
The personnel is more helpful than the season averages: Carlton Davis, Channing Canada and Karon Prunty are ruled out, while Kevin Byard and Craig Woodson are questionable. Burden’s 55.1% slot alignment means those absences do not create one simple replacement corner matchup. They do reduce NE’s options around a receiver CHI can move. The 50.5 total and mild current wind forecast support keeping him in the receiving conversation for Thursday night.
| Shell | Player rec / tgt | Player YPT | DEF YPT / tgt |
|---|---|---|---|
| Cover 1 | 4 / 5 | 8.80 | 5.31 / 49 |
| Cover 3 | 7 / 13 | 6.69 | 7.92 / 50 |
| Cover 2 | 4 / 5 | 9.20 | 9.15 / 39 |
A good receiver does not need the matchup oversold
| Team tgt share | Air Yds share | Overall YPRR |
|---|---|---|
| 23.4% | 34.1% | 2.52 |
| Type | Rts | Tgt | Rec | Yds | TPRR | YPRR |
|---|---|---|---|---|---|---|
| Man | 30 | 6 | 5 | 47 | 20.0% | 1.57 |
| Zone | 80 | 16 | 11 | 165 | 20.0% | 2.06 |
NYG’s 45.2% opponent man rate creates an obvious Collins headline. His current classified sample offers a more restrained version: six targets on 30 man routes, five catches and 47 Yds. His zone target rate is also 20.0%, with 165 Yds on 80 routes. There is no demonstrated target earning jump against man in this sample.
The Giants have allowed 5.98 Yds per target in Cover 1, 6.37 in Cover 3 and 5.00 in Cover 4. Collins has six catches for 73 Yds on nine Cover 1 targets and four for 81 on seven Cover 3 targets. His 2.52 overall Yds per route supplies the player quality argument. NYG’s seventh toughest downfield allowance and HOU favored by 10.5 make this a less convincing matchup upgrade than the man rate first implies. Collins can produce early; the script gives HOU little reason to chase extra passing volume if it gets clear.
| Shell | Player rec / tgt | Player YPT | DEF YPT / tgt |
|---|---|---|---|
| Cover 1 | 6 / 9 | 8.11 | 5.98 / 50 |
| Cover 3 | 4 / 7 | 11.57 | 6.37 / 51 |
| Cover 4 | 4 / 6 | 5.00 | 5.00 / 31 |
Zone coverage: find the opening inside the shell
Three shells, three different tests
Opponent Yds allowed per target. Higher allows more Yds. These outcomes cover all receiving positions.
| Matchup | C1 | C3 | C4 |
|---|---|---|---|
| PHI | 7.931 | 8.8395 | 6.7143 |
| SF | 6.8438 | 5.8764 | 6.0323 |
| PIT | 7.2381 | 5.1899 | 5.6596 |
| TB | 5.1212 | 6.018 | 4.6552 |
| LV | 7.4063 | 6.9016 | 8.2414 |
Where the zone production has come from
Yds per classified route. Exact route and target samples appear in each player brief.
| Matchup | Man | Zone |
|---|---|---|
| Drake London | 3.065 | 3.73 |
| Chris Olave | 2.138 | 3.014 |
| Jalen Coker | 1 | 3.403 |
| CeeDee Lamb | 2.389 | 2.753 |
| Puka Nacua | 2.95 | 2.814 |
A productive zone receiver meets a defense that closes windows
| Team tgt share | Air Yds share | Overall YPRR |
|---|---|---|
| 28.8% | 43.9% | 3.22 |
| Type | Rts | Tgt | Rec | Yds | TPRR | YPRR |
|---|---|---|---|---|---|---|
| Man | 31 | 6 | 4 | 95 | 19.4% | 3.06 |
| Zone | 122 | 36 | 27 | 455 | 29.5% | 3.73 |
London has 36 targets on 122 classified zone routes, producing 27 catches for 455 Yds. That is a 29.5% target rate and 3.73 Yds per route. His 28.8% overall team target share and 43.9% air Yds share make him the clear center of ATL’s receiving case. SF’s 76.3% opponent zone rate brings the right family of coverage for his established production.
The important complication is Cover 3. It represents 41.6% of SF’s shell tagged targets, yet the defense has allowed only 5.88 Yds per target across 89 throws. London has 15 catches for 284 Yds on 19 targets against that shell, so the receiver’s response is strong enough to take seriously even against resistance. SF also ranks fourth in explosive reception prevention. London’s +2.34 YAC above expectation per reception gives him another way to create value after the throw. This is a case for backing the receiver’s quality in a 50.5 total, without pretending SF has been giving those gains away.
| Shell | Player rec / tgt | Player YPT | DEF YPT / tgt |
|---|---|---|---|
| Cover 3 | 15 / 19 | 14.95 | 5.88 / 89 |
| Cover 4 | 5 / 8 | 7.75 | 6.03 / 31 |
| Cover 1 | 5 / 6 | 18.00 | 6.84 / 32 |
The zone demand is real. Paris changes the ceiling.
| Team tgt share | Air Yds share | Overall YPRR |
|---|---|---|
| 27.1% | 44.3% | 2.50 |
| Type | Rts | Tgt | Rec | Yds | TPRR | YPRR |
|---|---|---|---|---|---|---|
| Man | 58 | 14 | 11 | 124 | 24.1% | 2.14 |
| Zone | 144 | 44 | 31 | 434 | 30.6% | 3.01 |
Olave’s 44 zone targets on 144 classified routes are one of the larger samples on this board. They have produced 31 catches for 434 Yds, with a 30.6% target rate. PIT’s opponent zone rate is 76.9%, and Olave owns 27.1% of NO’s overall targets. The opportunity fit has more substance than a handful of favorable highlights.
PIT’s common shells are not generous: Cover 3 allows 5.19 Yds per target on 79 throws, while Cover 4 allows 5.66 on 47. Olave has 189 Yds on 19 Cover 3 targets and 101 on 14 Cover 4 targets. There is a softer Cover 2 allowance of 10.60, but that bucket represents only 9.6% of PIT’s shell tagged targets. Building the whole case around it would be shopping in the clearance aisle and calling it the entire store.
The game is in Paris, not the Superdome. Statyx’s October 22 forecast has sustained wind of 11 to 15 mph and gusts of 30 to 35 mph during the game window. That puts a real qualification on a receiver with 44.3% of NO’s air Yds. His target demand remains useful; the downfield ceiling needs the final Stade de France forecast to cooperate.
| Shell | Player rec / tgt | Player YPT | DEF YPT / tgt |
|---|---|---|---|
| Cover 3 | 11 / 19 | 9.95 | 5.19 / 79 |
| Cover 4 | 10 / 14 | 7.21 | 5.66 / 47 |
| Cover 2 | 6 / 7 | 9.71 | 10.60 / 20 |
Receptions and run after catch are the cleaner argument
| Team tgt share | Air Yds share | Overall YPRR |
|---|---|---|
| 24.5% | 28.9% | 2.53 |
| Type | Rts | Tgt | Rec | Yds | TPRR | YPRR |
|---|---|---|---|---|---|---|
| Man | 35 | 7 | 5 | 35 | 20.0% | 1.00 |
| Zone | 67 | 17 | 13 | 228 | 25.4% | 3.40 |
Coker’s zone response is stronger than his man response in both demand and efficiency. He has 17 zone targets on 67 routes, with 13 catches for 228 Yds. His man sample is seven targets on 35 routes and 35 Yds. The broader role supports the split: a 24.5% team target share, 35 targets in four appearances and 2.53 overall Yds per route.
TB’s opponent zone rate is 72.6%, and Cover 3 accounts for 50.9% of its shell tagged targets. Coker has eight catches for 112 Yds on 12 Cover 3 targets. The defense’s 6.02 Yds allowed per target across 111 Cover 3 throws is solid, so that exposure is not an automatic yardage gift. The more attractive opening comes after completions: TB allows 5.62 YAC per catch, ranked 27th for containment. With CAR favored by only three, this has a more balanced passing setup than a large favorite whose receivers need to finish the job before halftime.
| Shell | Player rec / tgt | Player YPT | DEF YPT / tgt |
|---|---|---|---|
| Cover 3 | 8 / 12 | 9.33 | 6.02 / 111 |
| Cover 1 | 6 / 7 | 9.57 | 5.12 / 33 |
| Cover 4 | 3 / 4 | 7.50 | 4.66 / 29 |
PHI’s Cover 3 is the opening; Cover 6 is the brake
| Team tgt share | Air Yds share | Overall YPRR |
|---|---|---|
| 28.8% | 38.6% | 2.63 |
| Type | Rts | Tgt | Rec | Yds | TPRR | YPRR |
|---|---|---|---|---|---|---|
| Man | 36 | 12 | 9 | 86 | 33.3% | 2.39 |
| Zone | 158 | 50 | 35 | 435 | 31.6% | 2.75 |
Lamb has 50 classified zone targets on 158 routes, with 35 catches for 435 Yds. His zone target rate is 31.6%, slightly below his man rate, so this is not a claim that he only gets open against zone. PHI’s 72.6% opponent zone rate simply puts his larger receiving sample into focus. His 69 overall targets and 28.8% team share make that opportunity difficult to ignore.
PHI’s Cover 3 has allowed 716 Yds on 81 targets, or 8.84 per target. Lamb has seven catches for 96 Yds on 12 targets against it. Cover 6 is a different proposition: PHI has allowed only 3.63 per target across 35 throws, even though Lamb’s own five targets have produced 67 Yds. He also has 20 catches for 215 Yds on 28 Cover 4 targets. That range of responses is more useful than labeling PHI a generic zone matchup. Lamb remains the strongest DAL volume case, with the defense offering a specific opening rather than unlimited room.
| Shell | Player rec / tgt | Player YPT | DEF YPT / tgt |
|---|---|---|---|
| Cover 3 | 7 / 12 | 8.00 | 8.84 / 81 |
| Cover 6 | 4 / 5 | 13.40 | 3.63 / 35 |
| Cover 4 | 20 / 28 | 7.68 | 6.71 / 28 |
Cover 4 and YAC support a role that already earns targets
| Team tgt share | Air Yds share | Overall YPRR |
|---|---|---|
| 31.9% | 40.6% | 2.78 |
| Type | Rts | Tgt | Rec | Yds | TPRR | YPRR |
|---|---|---|---|---|---|---|
| Man | 20 | 9 | 6 | 59 | 45.0% | 2.95 |
| Zone | 86 | 31 | 22 | 242 | 36.0% | 2.81 |
Puka does not need to be called a zone specialist for this to work. He has drawn targets on 45.0% of his 20 classified man routes and 36.0% of his 86 zone routes. Both rates are strong. The zone sample produced 22 catches for 242 Yds, while his broader Data Lab role carries a 31.9% team target share and 34.7% targets per route across four appearances.
LV’s opponent zone rate is 65.8%. Its Cover 4 has allowed 8.24 Yds per target across 29 throws, and Puka has caught 12 of his 13 Cover 4 targets for 119 Yds. Cover 3 is firmer at 6.90 allowed, with Puka catching six of 12 targets for 96 Yds. LV also allows 6.09 YAC per reception, ranked 29th for containment; Puka adds 2.08 YAC above expectation per catch in the core sample. Adams is on IR, which changes the available target tree, although his old share cannot simply be assigned to one teammate. Indoors, with a 47.5 total and LAR favored by four, Puka has the clearest combination of target earning and a credible finishing route.
| Shell | Player rec / tgt | Player YPT | DEF YPT / tgt |
|---|---|---|---|
| Cover 4 | 12 / 13 | 9.15 | 8.24 / 29 |
| Cover 3 | 6 / 12 | 8.00 | 6.90 / 61 |
| Cover 1 | 6 / 8 | 7.38 | 7.41 / 32 |
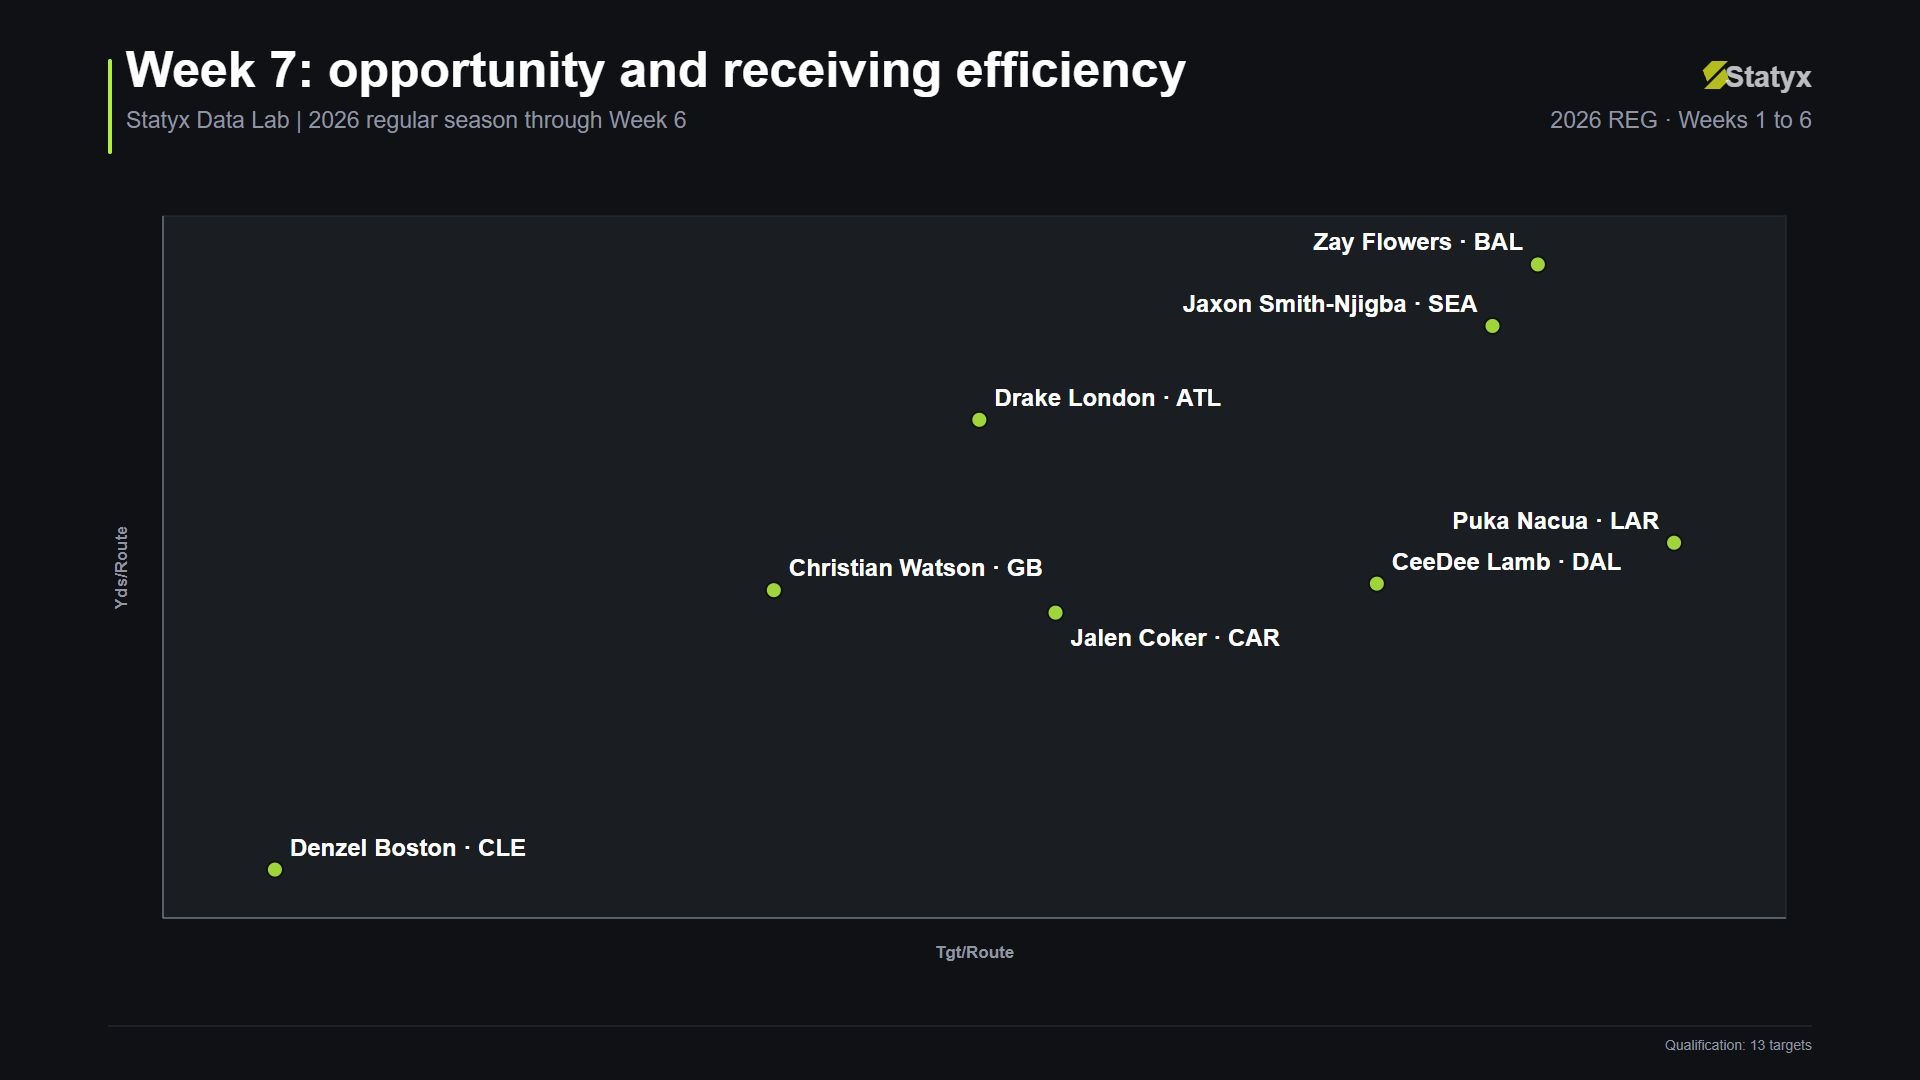
Three receiving ceilings worth a closer look
Two GB receivers, different coverage responses
Yds per classified route. Watson: 31 man routes and 141 zone. Golden: 29 and 149.
| Matchup | Man | Zone |
|---|---|---|
| Watson | 0.742 | 3.255 |
| Golden | 2.759 | 2.537 |
The zone production makes the DET ceiling credible
| Team tgt share | Air Yds share | Overall YPRR |
|---|---|---|
| 21.7% | 32.6% | 2.61 |
| Type | Rts | Tgt | Rec | Yds | TPRR | YPRR |
|---|---|---|---|---|---|---|
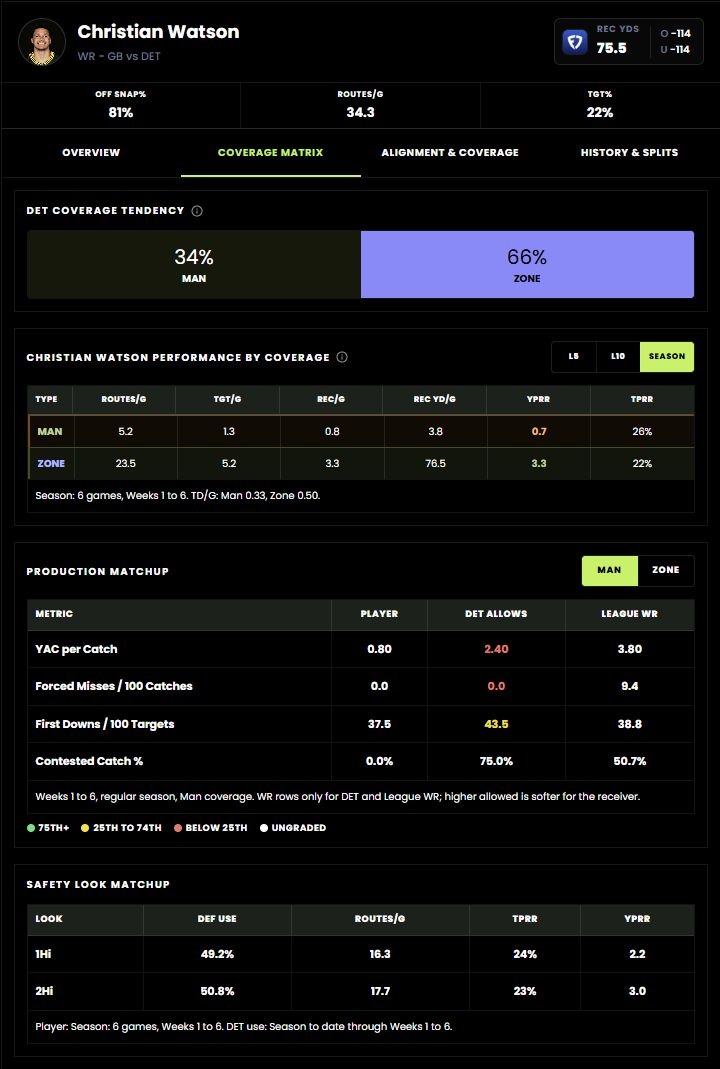
| Man | 31 | 8 | 5 | 23 | 25.8% | 0.74 |
| Zone | 141 | 31 | 20 | 459 | 22.0% | 3.26 |
Watson’s classified zone routes have produced 459 Yds on 141 routes, compared with 23 Yds on 31 man routes. The target rates are much closer than the yardage rates: 22.0% against zone and 25.8% against man. This is an efficiency split, not evidence that GB automatically throws to him more often when it sees zone.
DET’s opponent zone rate is 66.3%, and Watson has eight catches for 229 Yds on 16 Cover 3 targets. The defense allows 7.58 Yds per target in that shell, while its tighter Cover 4 allows 5.47. The broader downfield defense is the bigger opening: 13.44 Yds allowed per target on throws of at least 10 air Yds, ranked 29th. Golden owns more team targets and air Yds; Watson supplies the higher overall Yds per route and nine end zone targets. Both can be useful without requiring a fake winner of the same receiving room.
Watson’s ankle, Golden’s shoulder and Love’s back were all listed as limited on Wednesday’s estimated practice report. No final Sunday ruling is assumed. If Watson and Love carry normal roles, the 53.5 total at Ford Field gives this ceiling a much better setting than a weather dependent deep ball chase. DET’s league best YAC containment also points toward catches made downfield as the more convincing route to a big total.
| Shell | Player rec / tgt | Player YPT | DEF YPT / tgt |
|---|---|---|---|
| Cover 3 | 8 / 16 | 14.31 | 7.58 / 79 |
| Cover 4 | 4 / 7 | 7.43 | 5.47 / 34 |
| Cover 2 | 5 / 5 | 23.40 | 7.93 / 27 |
Zone changes the efficiency, not the target earning
| Team tgt share | Air Yds share | Overall YPRR |
|---|---|---|
| 19.8% | 44.8% | 1.62 |
| Type | Rts | Tgt | Rec | Yds | TPRR | YPRR |
|---|---|---|---|---|---|---|
| Man | 55 | 10 | 2 | 18 | 18.2% | 0.33 |
| Zone | 128 | 18 | 12 | 279 | 14.1% | 2.18 |
Boston has 279 Yds on 128 classified zone routes, versus 18 on 55 man routes. That is a substantial efficiency split, but his zone target rate is only 14.1%, below his 18.2% man rate. The case is better gains from the targets he gets, with 44.8% of CLE’s overall air Yds supplying reach. He is still a lower floor choice than the established volume leaders above.
TEN’s opponent zone rate is 75.9%. Its Cover 3 allows 7.76 Yds per target on 63 throws; Boston has only four catches for 46 Yds on nine targets against it. His better response has come in Cover 4, with five catches for 105 Yds on six targets, against TEN’s 6.57 allowed per target. Those six throws identify a ceiling mechanism rather than a dependable weekly expectation. Boston was limited Wednesday with his foot issue. In a game carrying a 37 total, this belongs on a selective yardage ceiling list, not at the top of a steady reception board.
| Shell | Player rec / tgt | Player YPT | DEF YPT / tgt |
|---|---|---|---|
| Cover 3 | 4 / 9 | 5.11 | 7.76 / 63 |
| Cover 4 | 5 / 6 | 17.50 | 6.57 / 56 |
| Cover 1 | 1 / 7 | 1.29 | 8.54 / 28 |
Monday offers several openings around a changed offense
| Team tgt share | Air Yds share | Overall YPRR |
|---|---|---|
| 32.8% | 48.3% | 2.21 |
| Type | Rts | Tgt | Rec | Yds | TPRR | YPRR |
|---|---|---|---|---|---|---|
| Man | 22 | 6 | 5 | 77 | 27.3% | 3.50 |
| Zone | 92 | 24 | 16 | 158 | 26.1% | 1.72 |
Smith’s 41 targets in four appearances represent a 32.8% team share and 48.3% of PHI’s air Yds. His six classified man targets produced five catches for 77 Yds on 22 routes. The zone sample is larger but less efficient: 24 targets and 158 Yds on 92 routes. DAL’s opponent man rate of 34.0% leaves room for either family to matter.
The defensive opening is unusually broad. DAL allows 7.85 Yds per target in Cover 1 and 7.97 in Cover 3. Smith’s Cover 1 response is five catches for 77 Yds on six targets; Cover 3 has yielded eight catches for 81 Yds on 14. Cover 6 is softer still at 12.57 allowed across 21 targets, with Smith producing 58 Yds on six of his own targets. That is supporting evidence across several shells, rather than one large catch doing all the arguing.
The offense still has to deliver it. Statyx’s current depth chart lists McKee first, and PHI’s own Week 7 coverage is preparing around him. Smith’s season splits are not a McKee only projection. With PHI a 4.5 point underdog, the game can preserve passing opportunities, but the quarterback change is the reason to frame this as an opportunity based ceiling rather than simply carry the old efficiency forward.
| Shell | Player rec / tgt | Player YPT | DEF YPT / tgt |
|---|---|---|---|
| Cover 1 | 5 / 6 | 12.83 | 7.85 / 39 |
| Cover 3 | 8 / 14 | 5.79 | 7.97 / 59 |
| Cover 6 | 4 / 6 | 9.67 | 12.57 / 21 |
Conditions that change the receiving read
Paris is the material weather adjustment: current gusts of 30 to 35 mph affect Olave’s vertical ceiling. CHI is forecast for 5 to 6 mph sustained wind with gusts up to 11; BAL and TEN currently have lighter wind. SEA carries a 22% to 31% rain chance with gusts up to 14. DET and LV are indoors. ATL and HOU have retractable roofs, so their outdoor forecasts are not proof of conditions inside. These are October 22 snapshots, not kickoff observations.
The final coverage board

Coverage board data
| Receiver / opponent | Read | Main route |
|---|---|---|
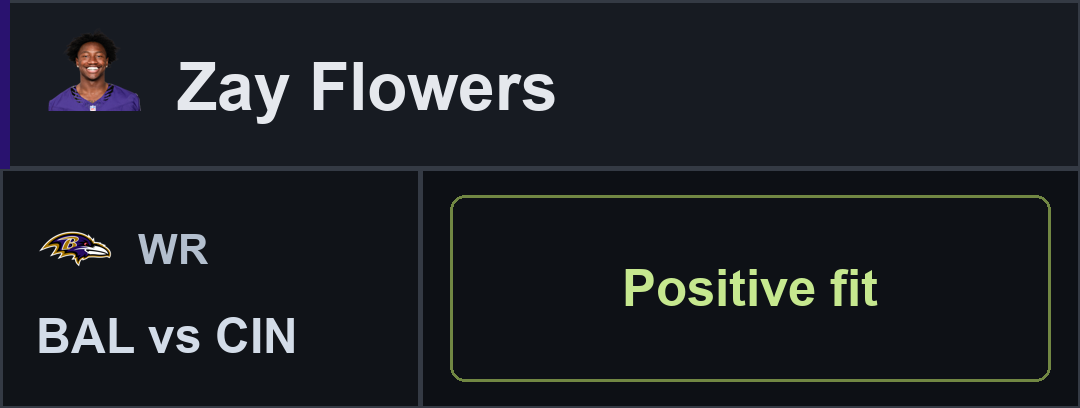
| Zay FlowersCIN | Positive fit | CIN’s Cover 1 gives the matchup a proper foundation |
| Jaxon Smith-NjigbaKC | Strong role, mixed fit | The targets travel better than the man efficiency |
| Carnell TateCLE | Temper the ceiling | The air Yds share is loud. CLE’s shell results answer back. |
| Luther Burden IIINE | Useful receiving fit | Thursday’s opportunity is broader than the man label |
| Nico CollinsNYG | Keep the role, curb the boost | A good receiver does not need the matchup oversold |
| Drake LondonSF | Player strength through resistance | A productive zone receiver meets a defense that closes windows |
| Chris OlavePIT | Volume supported | The zone demand is real. Paris changes the ceiling. |
| Jalen CokerTB | Positive PPR fit | Receptions and run after catch are the cleaner argument |
| CeeDee LambPHI | Strong role and shell fit | PHI’s Cover 3 is the opening; Cover 6 is the brake |
| Puka NacuaLV | Strong receiving fit | Cover 4 and YAC support a role that already earns targets |
| Christian WatsonDET | Ceiling if healthy | The zone production makes the DET ceiling credible |
| Denzel BostonTEN | Selective ceiling | Zone changes the efficiency, not the target earning |
| DeVonta SmithDAL | Opportunity with QB context | Monday offers several openings around a changed offense |
Explore the matchups in Statyx
Open Coverage Engine for the man and zone matrix, receiver shell responses and separate safety looks. Use Data Lab to check the broader role before turning a favorable split into a lineup decision.
For positional alternatives, read the Week 7 start/sit article. The Week 6 coverage article and Week 5 coverage article show the previous editions.
How the coverage read is built
Statistics cover the 2026 regular season through Week 6. Live Statyx Route IQ, Coverage Engine, Data Lab, depth chart, schedule, game line and weather research was pulled October 22, 2026. Route IQ’s published snapshot was generated at 15:28 UTC; game lines were updated at 16:30 UTC. Practice references retain the report day, chiefly Wednesday, October 21. Sunday and Monday final statuses were not yet established.
TPRR is targets divided by routes; YPRR is receiving Yds divided by routes; YPT is receiving Yds divided by targets, including incompletions. The tables show classified coverage samples. Overall target share, air Yds share and overall YPRR come from Data Lab and are kept separate because the returned core, family and shell samples do not reconcile exactly. Missing split outcomes remain unavailable, rather than zero.
Opponent man and zone percentages describe the family tendency returned by Statyx. Shell mix percentages in this article refer to the share of shell tagged opponent targets: they are not a share of every coverage snap or a forecast of this week’s calls. Shell allowances cover WR, TE and RB targets, while the featured player rows describe that receiver. Safety looks are a separate classification. Matching these layers is a football interpretation of historical samples, not a fitted statistical correlation or a projected receiving total.
A lower defensive prevention rank is tougher; rank 32 is softest. Small player shell samples remain descriptive. These matchup reads do not establish value at an unspecified sportsbook line.
Published for research and entertainment purposes. Not betting advice.



Discussion
Sign in to join the discussion.
Loading comments…