Why Hit Rate Alone Doesn't Tell the Full Story: How Statyx's NBA Trend Zone Cross-References Streaks With Play Type and Matchup Data
A player hits his points prop 9 times in his last 10 games. That number gets shared everywhere. Bettors pile in. The sportsbook adjusts the line. And most of those bettors never stop to ask the one question that actually matters: why is he hitting it, and does that reason hold up tonight? Hit rate…
 Statyx Staff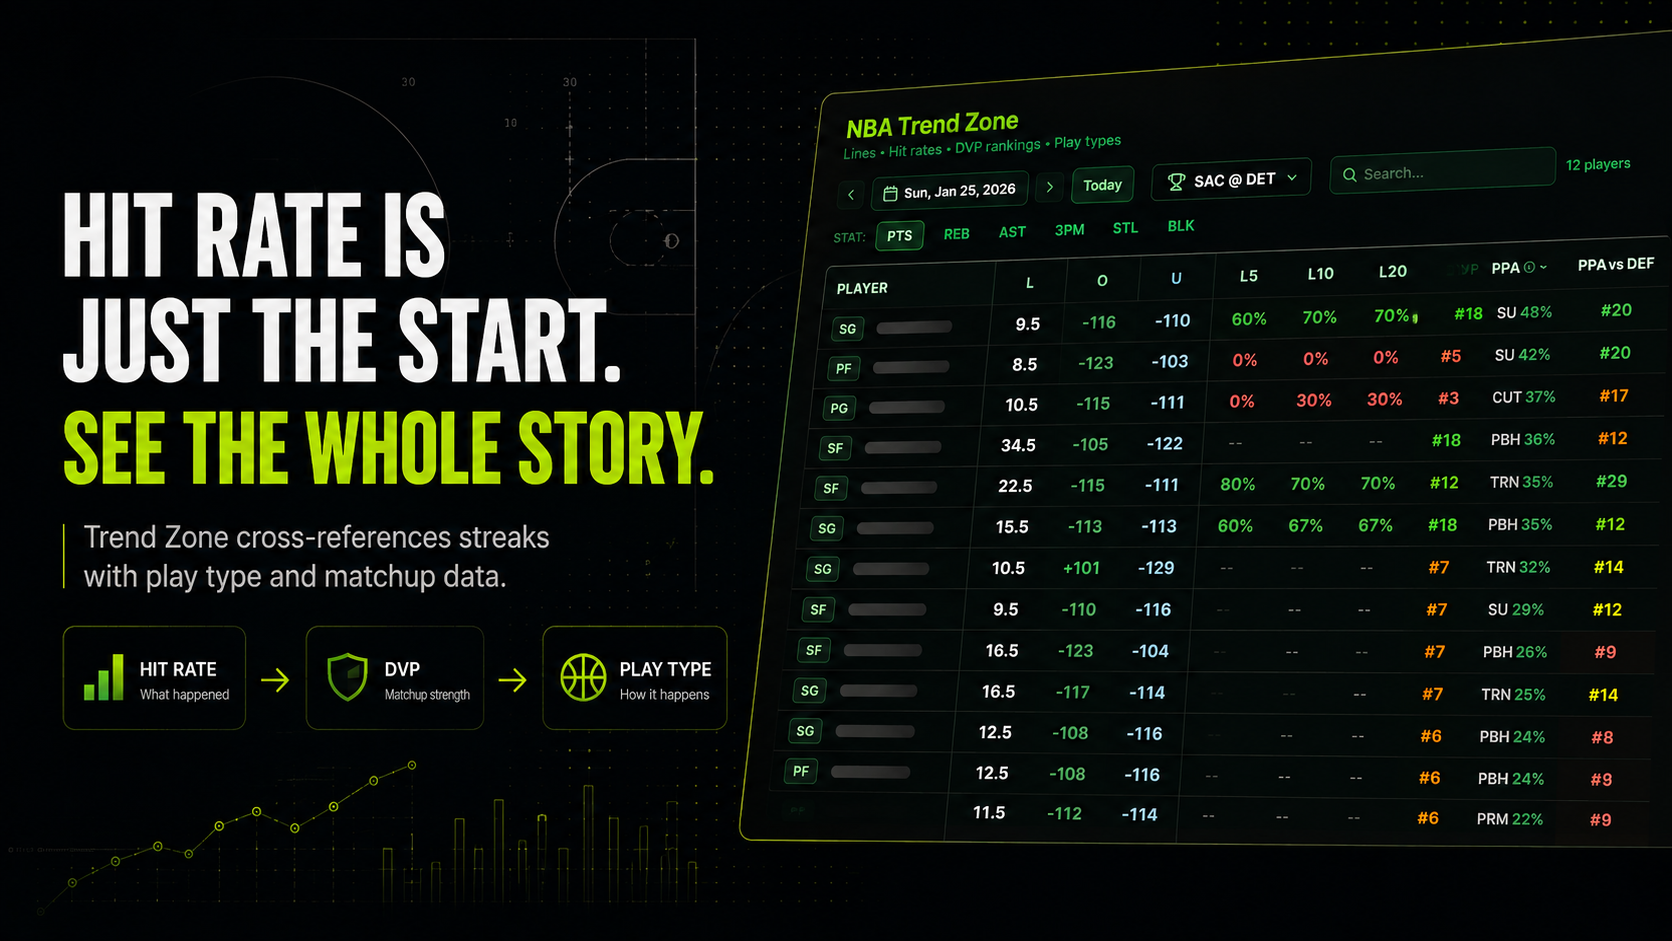
A player hits his points prop 9 times in his last 10 games. That number gets shared everywhere. Bettors pile in. The sportsbook adjusts the line. And most of those bettors never stop to ask the one question that actually matters: why is he hitting it, and does that reason hold up tonight?
Hit rate is a useful starting point. It is not a conclusion. Statyx's NBA Trend Zone was built around exactly that distinction.
The Problem With Raw Hit Rate
Streaks feel meaningful. When a player goes 8/10 or 9/10 on a prop line, the pattern looks reliable. But raw hit rate tells you nothing about the conditions that produced those results.
Was he hitting because he was getting to his spot in transition? Because he faced four straight teams that rank bottom-10 at defending his specific play type? Did the line move up two points after game three, making the last six games a different bet entirely?
None of that shows up in a simple percentage. You are looking at an outcome without a mechanism. And when you bet outcomes without mechanisms, you are essentially betting on streaks continuing for no particular reason.
That is a low-quality edge. Sometimes it works. Often it does not.
What Trend Zone Actually Shows You
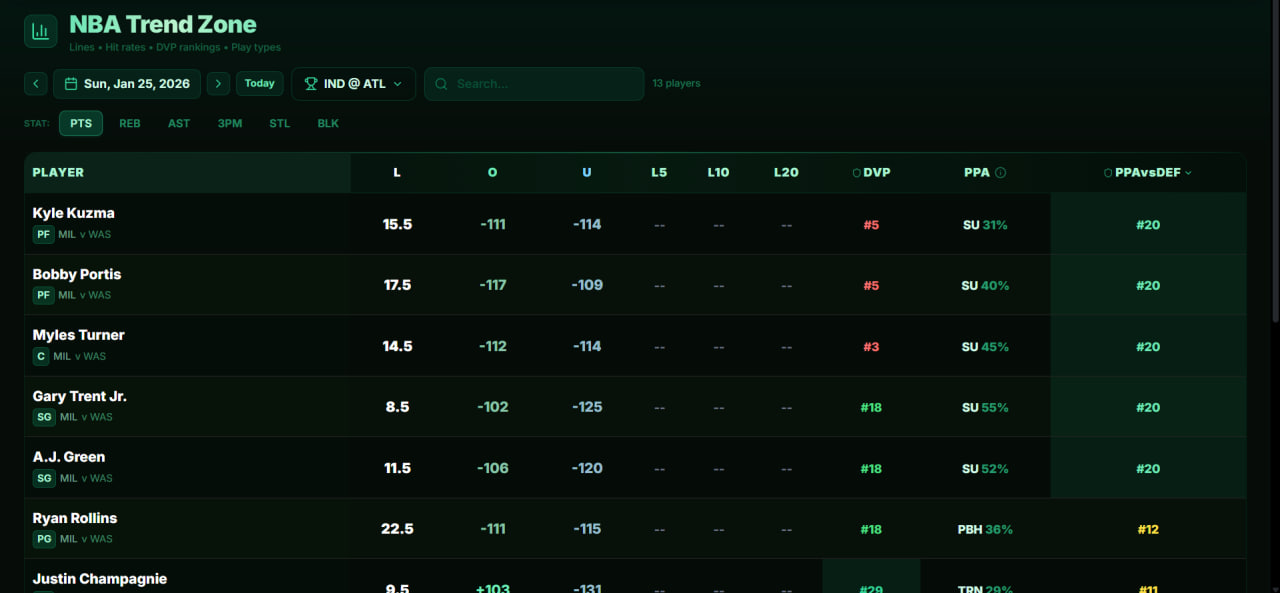
Trend Zone is a leaderboard inside Statyx that surfaces players hitting specific prop lines at high rates across recent games. It displays hit rate (9/10, 10/10, and so on), but it layers two additional data points directly alongside that number: DVP rank and PPA.
DVP rank is the defense vs. position ranking for the opposing team. It measures how well that defense has performed against players at the same position across the season. A rank of 1 means the best defense in the league at limiting that position. A rank of 30 means they give up the most.
PPA is play type. It identifies the dominant offensive action the player relies on most. Trend Zone uses six abbreviations:
- TRN (transition attack): a significant share of production comes in transition
- SU (spot up): the player operates primarily as a spot-up shooter
- PBH (pick and roll ball handler): he initiates pick and roll as the ball handler
- PRM (pick and roll man): he works as the roll man or screener
- CNS (catch and shoot): scoring comes predominantly from catch-and-shoot situations
- CUT (cut to the basket): he generates offense by cutting off the ball
The percentage next to each label shows how often the player uses that action per game. A player listed as SU 41% gets 41% of his offensive possessions from spot-up situations.
Together, these three layers let you evaluate whether a streak has a favorable setup going forward, or whether the matchup is about to work against it.
Why Play Type Changes Everything
This is the part most bettors skip entirely.
A defense does not defend every play type equally. A team can rank top-5 at limiting spot-up shooters while ranking 22nd at defending pick and roll ball handlers. Those are not the same defense. They are two different problems for two different player types.
When Trend Zone shows you a player's dominant play type alongside the opposing team's DVP rank, you can ask a sharper question: is this defense actually vulnerable to how this player scores?
A spot-up shooter trending at 9/10 on his points line is interesting. That same player going against a defense that ranks 4th at limiting spot-up opportunities is a different conversation. The streak happened. The matchup is working against it. Those two facts coexist, and Trend Zone shows you both at once.
Without play type data, you are comparing a player's production to a defense's overall position ranking. That is a blunt instrument. DVP rank alone does not tell you whether the defense is strong at the specific actions this player relies on.
A Concrete Example
A shooting guard listed in Trend Zone at 10/10 on his over 22.5 points line. His PPA shows PBH at 38%, meaning pick and roll ball handler actions drive more than a third of his offense. The opposing team's DVP rank for shooting guards is 27th.
That combination is worth examining closely. A defense ranked 27th at limiting shooting guards, facing a player who generates production through pick and roll initiation, is a real alignment. The streak has a mechanism. The matchup supports it.
Now flip the scenario. Same 10/10 hit rate. Same player. But his PPA shows SU at 44%, and the opposing defense ranks 3rd at limiting spot-up shooters. The hit rate looks identical. The underlying setup is completely different. The defense is specifically built to take away the thing he does most.
Trend Zone puts those two scenarios side by side so you can see the difference before you place the bet.
Three Layers, One Decision
Trend Zone does not tell you who to bet. It tells you which streaks have structural support and which ones are floating on recent variance.
Hit rate shows you what has happened. DVP rank shows you how the opposing defense performs at the position level. Play type shows you whether that defense is strong or weak at the specific actions driving the player's production. When all three point in the same direction, the bet has a real foundation. When they conflict, you know to look harder before committing.
This is the difference between using data and using a number. A single percentage is a number. Hit rate plus DVP rank plus dominant play type is a data-informed argument.
Most bettors are working with the number. Trend Zone gives you the argument.
Start With the Right Tool
If you are researching NBA player props and starting from hit rate leaderboards without play type context, you are missing the most important part of the analysis. The streak might be real. The matchup might be wrong for it.
Statyx's Trend Zone was built to close that gap.
Frequently Asked Questions
What is Statyx's NBA Trend Zone? Trend Zone is a leaderboard inside Statyx that shows NBA players hitting specific prop lines at high rates (such as 8/10, 9/10, or 10/10), cross-referenced with the opposing team's defense vs. position rank and the player's dominant offensive play type.
What does PPA mean in Trend Zone? PPA stands for play type. It identifies the dominant offensive action a player uses most frequently. The six types are TRN (transition attack), SU (spot up), PBH (pick and roll ball handler), PRM (pick and roll man), CNS (catch and shoot), and CUT (cut to the basket). The percentage next to each label shows how often the player uses that action per game.
Why isn't hit rate enough on its own for NBA prop research? Hit rate shows you what has happened over recent games, but it does not explain why. Without knowing the matchup context and the player's production style, you cannot assess whether the conditions that produced the streak are likely to repeat in the next game.
How does DVP rank work in Trend Zone? DVP rank measures how well an opposing defense has performed against players at the same position across the season. A rank of 1 means the best defense at limiting that position. A rank of 30 means they give up the most. Trend Zone displays this rank alongside the player's hit rate so you can assess the matchup at a glance.
Can two players with the same hit rate have very different matchup quality? Yes. Two players both trending at 9/10 can face completely different defensive environments depending on their play type. A spot-up shooter going against a top-5 defense at limiting spot-up opportunities is in a much harder spot than a pick and roll ball handler facing a weak PBH defense, even if their recent hit rates look identical.
Is Trend Zone designed to give me picks? No. Trend Zone is a research tool. It surfaces structural alignment or misalignment between a player's recent production, their play style, and the upcoming matchup. The decision is yours. The data is there to make that decision more informed.
What sports and leagues does Statyx cover beyond the NBA? Statyx covers major sports leagues and includes tools for MLB props as well, with features like the K Engine for strikeout analysis and the HR QUANT model for home run prop research. The NBA Trend Zone is one module within a broader analytics platform.
Published for research and entertainment purposes. Not betting advice.

Discussion
Sign in to join the discussion.
Loading comments…