NFL Week 9 Man vs Zone: Flournoy, Jameson and the Coverage Traps
Flournoy and Jameson lead the receiving openings. Thirteen Week 9 matchups, tested against coverage shells and target areas.
Get the tools behind this post. Free Statyx account, no card needed.
Sign up free Kaz

IND’s Cover 3 leaves room for Flournoy. MIA’s downfield defense fits Jameson. Shakir, Tucker and Wilson face zone heavy opponents whose main shells or target areas are much harder to beat.
Data through Week 8 · Updated November 4, 2026
Specific openings · Selective fits · Coverage traps · Final board
Who earns more targets against which family?
Man TPRR on the horizontal axis, zone TPRR on the vertical. Each color identifies one receiver.
| Man TPRR (%) | Flournoy | Allen | Downs | Vele | Mitchell | Douglas |
|---|---|---|---|---|---|---|
| 26 | 12.941176470588236 | |||||
| 30.76923076923077 | 26.262626262626263 | |||||
| 30.90909090909091 | 13.609467455621301 | |||||
| 19.11764705882353 | 13.953488372093023 | |||||
| 11.764705882352942 | 27.941176470588236 | |||||
| 31.70731707317073 | 17.142857142857142 |
Specific openings beyond the headline names
Cover 3: player response meets the defense
Historical Yds per target. These are separate player and defensive samples.
| DEF Cover 3 YPT allowed | Williams | Flournoy | Higgins | Tucker | Wilson | Boston |
|---|---|---|---|---|---|---|
| 8.4912 | 12 | |||||
| 8.5467 | 14 | |||||
| 6.56 | 13.578947368421053 | |||||
| 6.0096 | 11.5 | |||||
| 5.1333 | 5.75 | |||||
| 7.65 | 5.083333333333333 |
How much does zone change the return?
Two points per receiver: man and zone Yds per classified route.
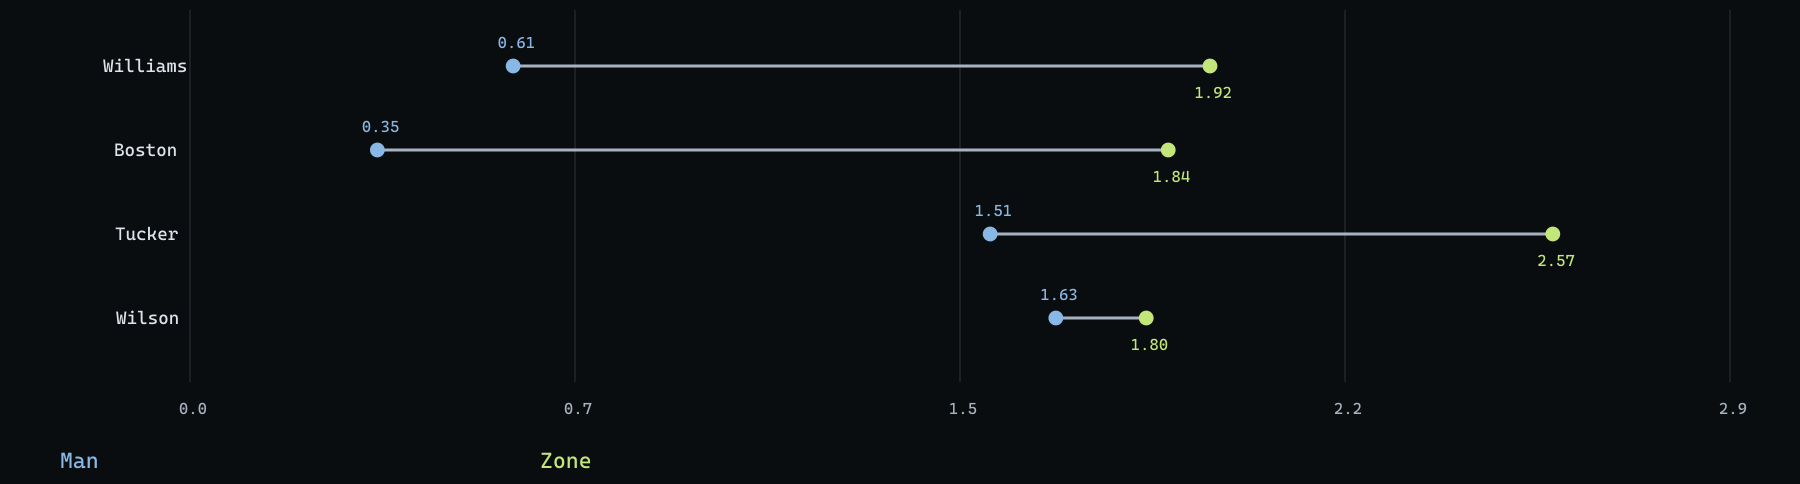
Chart data
| Player | Man YPRR | Zone YPRR |
|---|---|---|
| Williams | 0.61 | 1.92 |
| Boston | 0.35 | 1.84 |
| Tucker | 1.51 | 2.57 |
| Wilson | 1.63 | 1.80 |

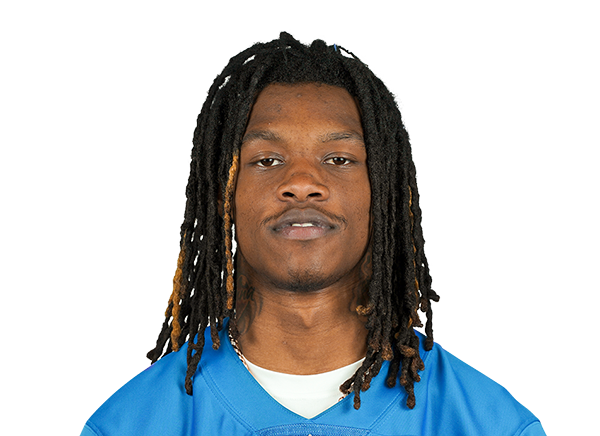
Jameson Williams
WR ·DET at MIA
Positive fitMIA gives his zone production a useful downfield assignment
Team tgt 18.0% · Air Yds 34.8% · Off snaps 88.2%
| Player production | Opponent shells | |||||||
|---|---|---|---|---|---|---|---|---|
| Metric | Overall | Man (23) | Zone (178) | Shell | Rec / tgt | Yds | DEF YPT / N | Tgt % |
| Yds | 437 | 14 | 342 | Cover 3 | 9 / 13 | 156 | 8.49 / 57 | 29.4% |
| TPRR | 17.1% | 13.0% | 16.9% | Cover 6 | 6 / 8 | 69 | 8.63 / 38 | 19.6% |
| YPRR | 1.74 | 0.61 | 1.92 | Cover 2 | 6 / 8 | 111 | 6.47 / 34 | 17.5% |
Williams has 342 Yds on 178 classified zone routes, or 1.92 per route, against 14 on 23 man routes. MIA uses zone on 74.8% of its classified family sample. The stronger overlap is Cover 3: Williams has nine catches for 156 Yds on 13 targets, while MIA has allowed 484 Yds on 57 throws into that shell. That 8.49 YPT ranks 29th for prevention.
Williams has caught four of five intermediate right targets for 58 Yds. MIA has conceded 235 Yds on 12 targets there, or 19.58 YPT, ranked 31st. Twelve targets alone would be thin evidence. MIA also ranks last on all throws travelling at least 10 air Yds, allowing 17.69 YPT. The weakness extends beyond one patch of the field.
His role is improving too: 15 targets and a 26.8% DET share across its two games in Weeks 6 to 8, versus 18.0% for the season. Goff has +0.247 EPA per dropback in this Route IQ sample. DET is favored by seven. I like the room for useful intermediate and downfield catches more than a bet on a huge reception total.
Explore Jameson Williams in Route IQ

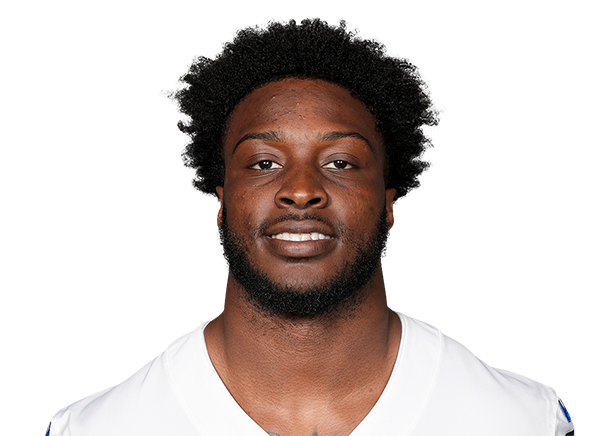
Ryan Flournoy
WR ·DAL at IND
Secondary openingIND leaves room for the smaller job in DAL’s passing game
Team tgt 15.0% · Air Yds 13.6% · Off snaps 73.8%
| Player production | Opponent shells | |||||||
|---|---|---|---|---|---|---|---|---|
| Metric | Overall | Man (50) | Zone (170) | Shell | Rec / tgt | Yds | DEF YPT / N | Tgt % |
| Yds | 342 | 69 | 211 | Cover 3 | 6 / 7 | 98 | 8.55 / 75 | 31.6% |
| TPRR | 16.7% | 26.0% | 12.9% | Cover 1 | 2 / 4 | 26 | 7.69 / 45 | 19.0% |
| YPRR | 1.33 | 1.38 | 1.24 | Cover 2 | 4 / 5 | 58 | 6.64 / 33 | 13.9% |
Flournoy has 44 targets, 30 catches and a 15.0% team target share. His last three games supplied 17 targets and 77.7% of offensive snaps. IND has allowed 641 Yds on 75 Cover 3 targets, or 8.55 YPT, ranked 30th. Flournoy has six catches on seven looks against that shell for 98 Yds. The defensive weakness is well established; his own seven targets are a much smaller sample.
There are shorter routes into the matchup as well. His short left work is ten catches on 14 targets for 82 Yds, against IND allowing 6.71 YPT there. Short right adds seven of eight for another 82, against 7.29 allowed. IND ranks 31st at YAC prevention, giving ordinary completions a chance to keep going. Flournoy splits his alignment almost evenly between slot and wide.
Here is the catch: Flournoy earns targets more often against man, at 26.0% versus 12.9% in zone. His man YPRR is slightly higher too. The appeal comes from where IND allows catches and YAC, rather than a blanket zone upgrade. Lamb and Pickens still get the bigger portions. A 51.5 total and Dak’s +0.156 EPA per dropback make Flournoy’s existing share worth a look.
Explore Ryan Flournoy in Route IQ

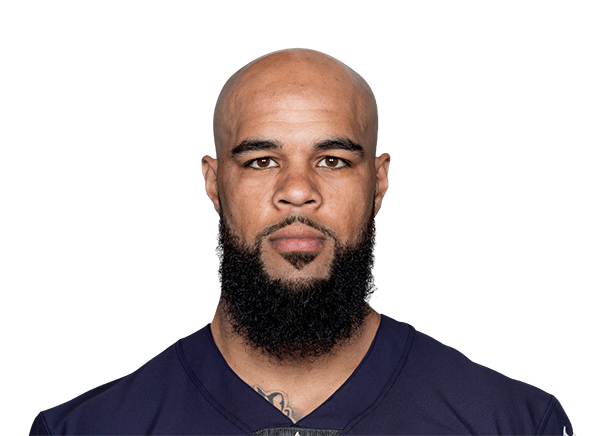
Keenan Allen
WR ·IND vs DAL
Possession fitDAL’s short field gaps line up with the completions he already earns
Team tgt 22.1% · Air Yds 21.3% · Off snaps 58.8%
| Player production | Opponent shells | |||||||
|---|---|---|---|---|---|---|---|---|
| Metric | Overall | Man (39) | Zone (99) | Shell | Rec / tgt | Yds | DEF YPT / N | Tgt % |
| Yds | 325 | 52 | 184 | Cover 3 | 8 / 12 | 52 | 7.20 / 81 | 31.4% |
| TPRR | 27.6% | 30.8% | 26.3% | Cover 1 | 5 / 8 | 45 | 6.89 / 66 | 25.6% |
| YPRR | 1.76 | 1.33 | 1.86 | Cover 4 | 8 / 8 | 69 | 6.59 / 51 | 19.8% |
Allen has caught 21 of 26 classified zone targets for 184 Yds. His target rate is 26.3% in that family, almost twice Downs’s 13.6%, and DAL uses zone on 65.3% of its family sample. Allen also owns 22.1% of IND targets across his seven appearances. His 21 targets in Weeks 6 to 8 represent a 23.6% share in those games.
Short left is the cleanest overlap: 17 catches on 20 targets for 129 Yds. DAL allows 6.84 YPT there, ranked 29th. Short middle adds seven catches on eight looks for 57 Yds against DAL’s 8.52 allowance, ranked 31st. Allen already earns these throws. IND does not need to invent a new role for him.
Allen aligns wide on 72.6% of charted snaps, so this is broader than a slot matchup. His 97.4% route rate covers his own passing play snaps; he plays 58.8% of total offensive snaps. Daniel Jones has minus 0.201 EPA per dropback in 2026. With IND getting six, I prefer Allen’s access to short completions over expecting the whole passing game to turn explosive.
Explore Keenan Allen in Route IQ

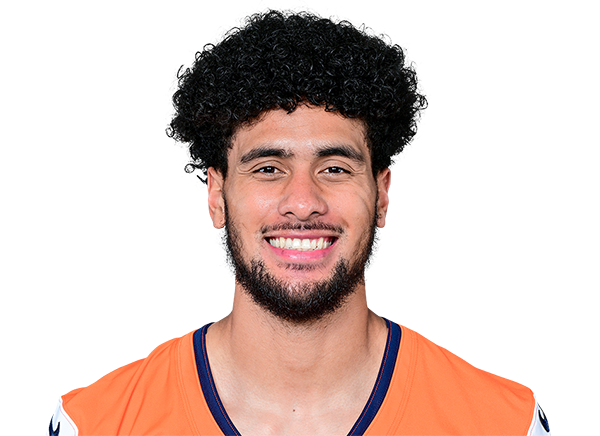
Devaughn Vele
WR ·NO vs CLE
Selective man fitCLE’s man frequency offers a workable assignment inside a tougher overall defense
Team tgt 18.2% · Air Yds 24.7% · Off snaps 91.2%
| Player production | Opponent shells | |||||||
|---|---|---|---|---|---|---|---|---|
| Metric | Overall | Man (68) | Zone (172) | Shell | Rec / tgt | Yds | DEF YPT / N | Tgt % |
| Yds | 348 | 110 | 204 | Cover 1 | 6 / 9 | 72 | 6.77 / 113 | 42.0% |
| TPRR | 16.4% | 19.1% | 14.0% | Cover 3 | 11 / 16 | 150 | 4.30 / 83 | 30.9% |
| YPRR | 1.27 | 1.62 | 1.19 | Cover 4 | 5 / 7 | 44 | 4.00 / 29 | 10.8% |
Vele has played 91.3% of NO offensive snaps and owns an 18.3% target share. His classified man sample is nine catches for 110 Yds on 13 targets across 68 routes. That is a 19.1% target rate and 1.62 YPRR, compared with 14.0% and 1.19 in zone. CLE’s family sample is 57.3% man, making this a relevant difference.
CLE uses Cover 1 on 42.0% of shell tagged targets and allows 6.77 YPT, ranked 19th. Vele has six catches on nine looks for 72 Yds against it. That is a workable assignment. CLE’s Cover 3 and Cover 4 both rank first for YPT prevention, which makes its man coverage the more appealing part of the matchup.
Vele’s favorite area is less helpful: 20 of his 48 targets have gone short left, where CLE allows only 5.75 YPT. His recent share is 16.2% across NO’s two games in Weeks 6 to 8. The playing time is there, and man has suited him better. I would keep him on the secondary receiver list rather than treat CLE as an across the board upgrade.
Explore Devaughn Vele in Route IQ
Recent targets: opportunity is not flat
Jameson has no Week 6 game. Missing games stay blank, not zero.
| Week | Flournoy | Williams | Allen |
|---|---|---|---|
| W6 | 9 | 11 | |
| W7 | 4 | 9 | 3 |
| W8 | 4 | 6 | 7 |
Target demand and the shell do not always agree
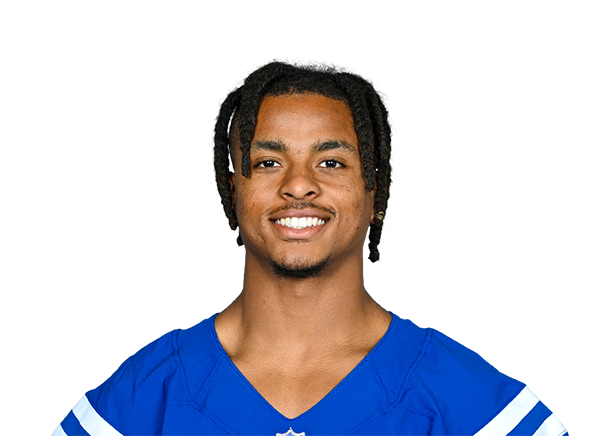
Josh Downs
WR ·IND vs DAL
Field fit, mixed familyThe same DAL matchup favors Allen’s zone demand more clearly
Team tgt 20.0% · Air Yds 28.6% · Off snaps 80.8%
| Player production | Opponent shells | |||||||
|---|---|---|---|---|---|---|---|---|
| Metric | Overall | Man (55) | Zone (169) | Shell | Rec / tgt | Yds | DEF YPT / N | Tgt % |
| Yds | 330 | 126 | 171 | Cover 3 | 9 / 15 | 114 | 7.20 / 81 | 31.4% |
| TPRR | 16.7% | 30.9% | 13.6% | Cover 1 | 6 / 14 | 87 | 6.89 / 66 | 25.6% |
| YPRR | 1.20 | 2.29 | 1.01 | Cover 4 | 3 / 8 | 27 | 6.59 / 51 | 19.8% |
Downs earns targets on 30.9% of his man routes: 17 looks across 55 routes, producing 126 Yds. In zone, that falls to 23 targets on 169 routes, or 13.6%, with 171 Yds. DAL’s 65.3% zone tendency therefore puts the less productive family in the larger part of the assignment.
The field locations still offer a reason to stay interested. Downs has caught six of seven short middle targets for 71 Yds, with DAL allowing 8.52 YPT there. Short right is eight of ten for 57 against 7.22 allowed. DAL ranks 31st at both locations. His 69.6% slot alignment is a clearer slot role than Allen’s, but alignment alone has not created the same zone target demand.
Downs has 51 season targets and plays 80.8% of offensive snaps. He gets more total snap access than Allen, but Allen draws targets much more often against zone. That is the choice inside this matchup: Downs has the playing time, Allen has the stronger response to DAL’s preferred coverage.
Explore Josh Downs in Route IQ

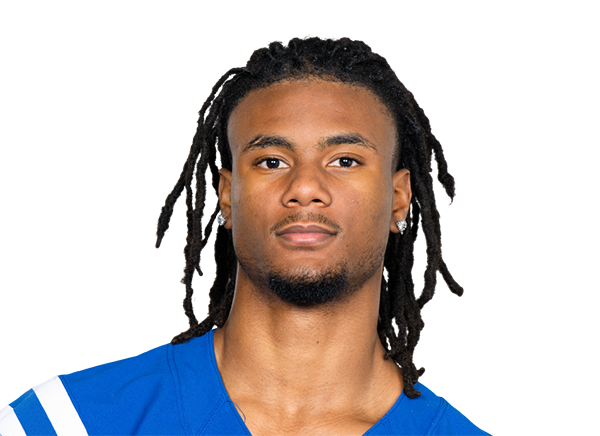
Adonai Mitchell
WR ·NYJ at KC
Selective Cover 3 fitKC offers a zone opening, with more man resistance than the last matchup
Team tgt 22.7% · Air Yds 45.5% · Off snaps 65.1%
| Player production | Opponent shells | |||||||
|---|---|---|---|---|---|---|---|---|
| Metric | Overall | Man (17) | Zone (68) | Shell | Rec / tgt | Yds | DEF YPT / N | Tgt % |
| Yds | 265 | 17 | 179 | Cover 3 | 9 / 12 | 126 | 7.69 / 70 | 29.3% |
| TPRR | 22.9% | 11.8% | 27.9% | Cover 4 | 5 / 6 | 75 | 6.34 / 56 | 23.4% |
| YPRR | 2.52 | 1.00 | 2.63 | Cover 1 | 1 / 2 | 17 | 5.69 / 36 | 15.1% |
Mitchell has 13 catches for 179 Yds on 19 zone targets across 68 routes, a 27.9% target rate and 2.63 YPRR. His man sample contains only two targets on 17 routes. His broader role covers four appearances: 27 targets and 45.5% of team air Yds in those games. That share does not describe all eight NYJ games.
KC’s Cover 3 allows 538 Yds on 70 targets, or 7.69 YPT, ranked 22nd. Mitchell has nine catches for 126 Yds on 12 Cover 3 looks. Cover 4 adds five of six for 75, against KC allowing 6.34 YPT. There are specific zone responses here, not just one big catch carrying the entire sample.
KC still uses man on 41.7% of its family sample. Its Cover 1 allows 5.69 YPT, ranked 11th, and Mitchell has one catch on two targets against it. His zone demand and air Yds role keep him interesting. There is much less evidence that he can produce against the man coverage KC mixes in.
Explore Adonai Mitchell in Route IQ

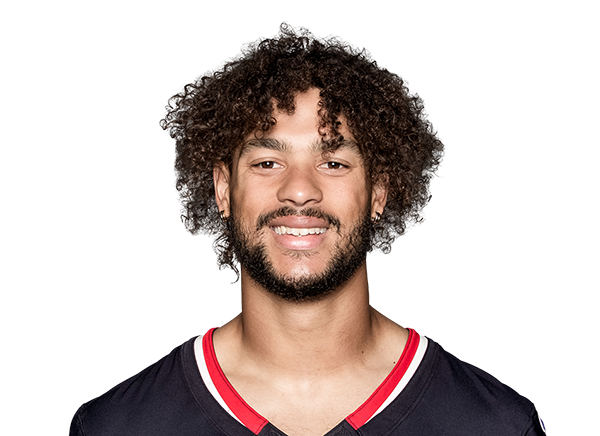
Xavier Hutchinson
WR ·HOU at LAC
Modest Cover 3 openingLAC’s main shell is useful, but the recent allocation stays small
Team tgt 17.3% · Air Yds 21.2% · Off snaps 54.6%
| Player production | Opponent shells | |||||||
|---|---|---|---|---|---|---|---|---|
| Metric | Overall | Man (36) | Zone (90) | Shell | Rec / tgt | Yds | DEF YPT / N | Tgt % |
| Yds | 258 | 90 | 152 | Cover 3 | 7 / 15 | 120 | 7.75 / 59 | 30.3% |
| TPRR | 23.4% | 36.1% | 22.2% | Cover 6 | 1 / 3 | 6 | 6.48 / 33 | 16.9% |
| YPRR | 1.63 | 2.50 | 1.69 | Cover 4 | 6 / 7 | 66 | 6.16 / 32 | 16.4% |
Hutchinson has 40 targets and a 17.3% season team share. Against Cover 3, he has seven catches on 15 targets for 120 Yds. LAC allows 7.75 YPT against that shell, ranked 24th, across 59 targets. That is a useful opening for a receiver who rarely headlines the matchup.
His strongest target demand has come against man: 13 targets on 36 routes, or 36.1%, compared with 22.2% in zone. LAC uses zone on 73.7% of its classified family sample. Hutchinson’s zone YPRR is 1.69, against 2.50 in man. The softer Cover 3 result helps, but the family mix does not maximize his target earning split.
His recent role is smaller: nine targets, a 15.0% share and 54.8% of offensive snaps across HOU’s two games in Weeks 6 to 8. He is third on the current depth chart. LAC also ranks ninth against his short middle area at 6.80 YPT. I would keep the receiving expectation modest and give him a specific Cover 3 upgrade.
Explore Xavier Hutchinson in Route IQ


Tee Higgins
WR ·CIN at ATL
Quality meets resistanceAn excellent man response gets ATL’s strongest common shell
Team tgt 23.4% · Air Yds 41.2% · Off snaps 79.7%
| Player production | Opponent shells | |||||||
|---|---|---|---|---|---|---|---|---|
| Metric | Overall | Man (36) | Zone (173) | Shell | Rec / tgt | Yds | DEF YPT / N | Tgt % |
| Yds | 726 | 160 | 449 | Cover 3 | 14 / 19 | 258 | 6.56 / 100 | 34.0% |
| TPRR | 23.6% | 33.3% | 22.0% | Cover 1 | 9 / 11 | 160 | 3.91 / 80 | 27.2% |
| YPRR | 2.86 | 4.44 | 2.60 | Cover 4 | 6 / 11 | 73 | 7.52 / 64 | 21.8% |
Higgins has 160 Yds on 36 classified man routes, or 4.44 YPRR, and earns a target on 33.3% of those routes. His zone output is strong too: 449 Yds on 173 routes, or 2.60 per route. The broader role is 61 targets in seven games, with 18 targets and 3.61 overall YPRR across CIN’s last two appearances.
ATL’s Cover 1 allows only 3.91 YPT across 80 targets, second toughest. Higgins has answered that shell with nine catches for 160 Yds on 11 looks. Both sides have a case here. ATL uses man on 36.2% of its family sample, so Higgins will also spend plenty of the game outside his best split.
Cover 3 is more ordinary at 6.56 YPT allowed, ranked 13th; Higgins has 258 Yds on 19 targets against it. ATL’s Cover 4 is softer at 7.52, although Higgins has 73 Yds on 11 looks there. His own production is excellent. The defensive mix gives me less reason to add another matchup boost.
Explore Tee Higgins in Route IQ

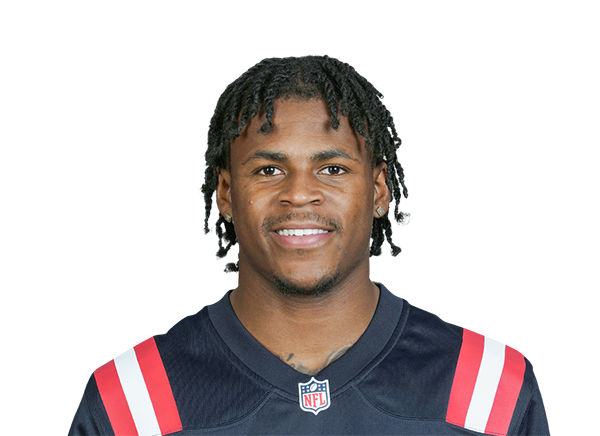
DeMario Douglas
WR ·NE vs GB
Short catch fitHis best man split is less useful against GB’s zone heavy mix
Team tgt 16.2% · Air Yds 18.6% · Off snaps 56.1%
| Player production | Opponent shells | |||||||
|---|---|---|---|---|---|---|---|---|
| Metric | Overall | Man (41) | Zone (105) | Shell | Rec / tgt | Yds | DEF YPT / N | Tgt % |
| Yds | 332 | 128 | 176 | Cover 4 | 2 / 3 | 45 | 4.96 / 73 | 25.9% |
| TPRR | 18.5% | 31.7% | 17.1% | Cover 3 | 7 / 10 | 71 | 7.54 / 63 | 22.3% |
| YPRR | 1.70 | 3.12 | 1.68 | Cover 2 | 5 / 5 | 82 | 5.18 / 55 | 19.5% |
Douglas has earned 13 targets on 41 man routes, a 31.7% rate, with 128 Yds. In zone, his rate falls to 17.1%, with 176 Yds on 105 routes. GB uses zone on 74.9% of its family sample. Its Cover 4 allows 4.96 YPT, ranked fourth, and Cover 2 allows 5.18, ranked sixth. The headline man split is not the assignment he gets most often.
Short right is the better angle: nine catches on nine targets for 68 Yds. GB allows 5.94 YPT there, ranked 23rd, across 50 targets. Douglas aligns in the slot on 82.5% of charted snaps. I prefer the case for short completions to the case for a big yardage ceiling.
Douglas has 15 targets and a 19.0% share over the last three games. Maye’s 2026 CPOE is +7.3 percentage points in this Route IQ sample. The current forecast has sustained wind around 10 to 11 mph and gusts up to 26. A.J. Brown and Hunter Henry remain questionable, so I have kept Douglas’s current role rather than handing him their targets.
Explore DeMario Douglas in Route IQ
Three defenses, four receiving tests
Allowance rank mapped to 0 to 100: toughest to softest. No combined score.
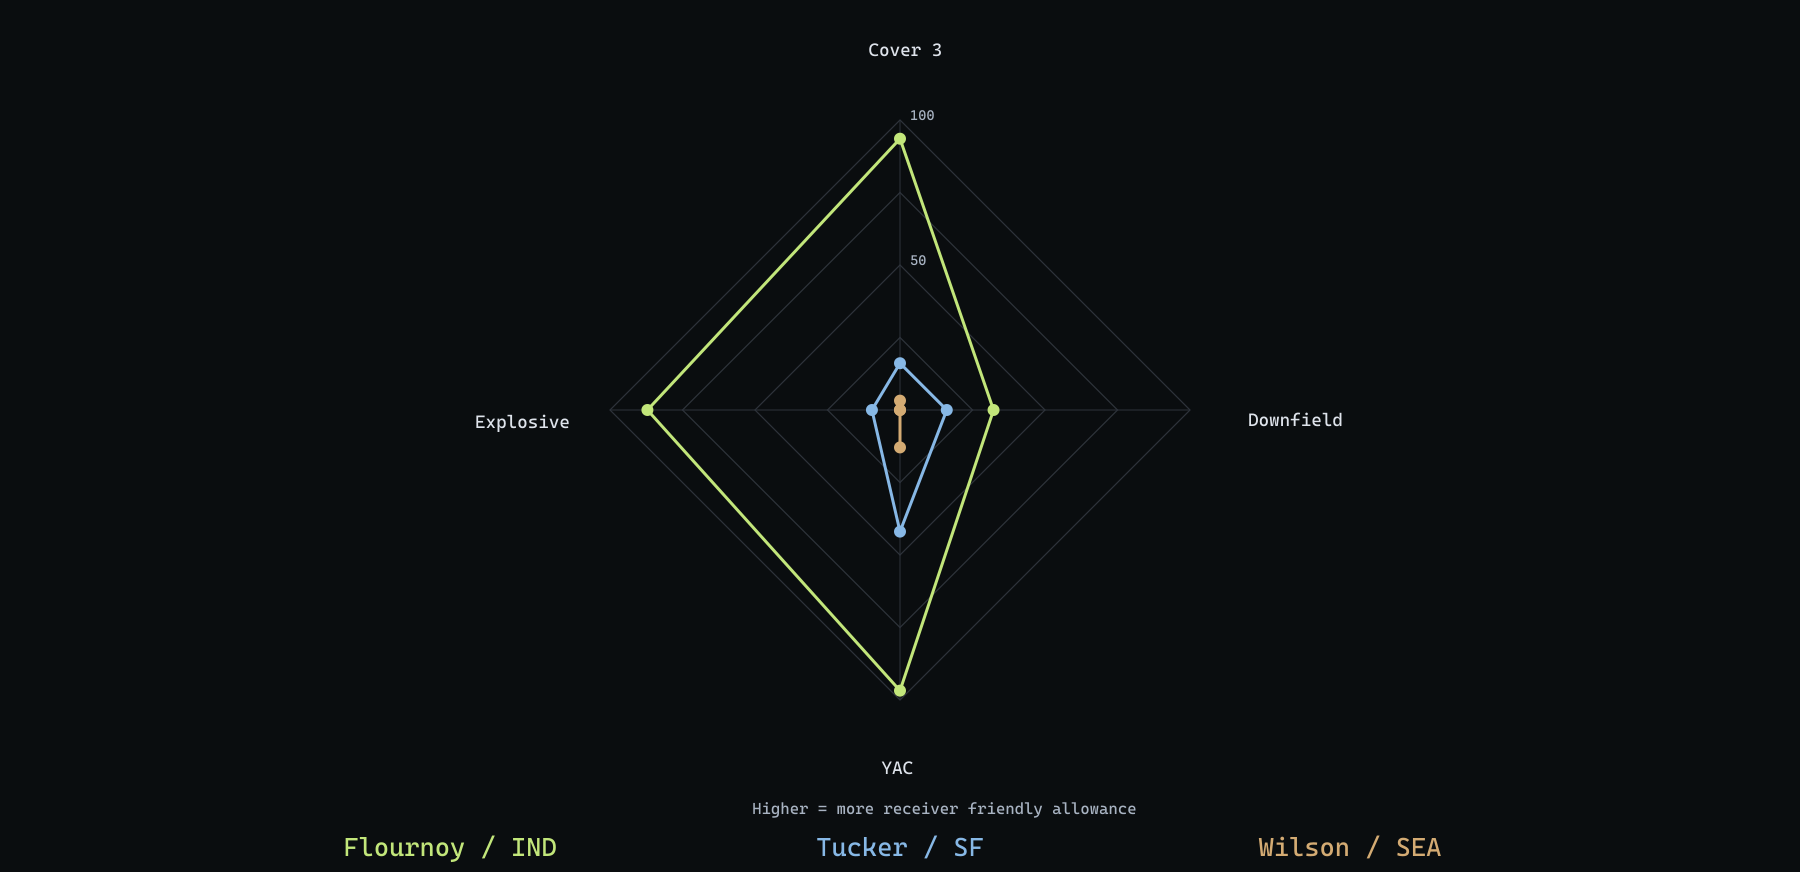
Chart data
| Allowance rank | Flournoy / IND | Tucker / SF | Wilson / SEA |
|---|---|---|---|
| Cover 3 | 30 | 6 | 2 |
| Downfield | 11 | 6 | 1 |
| YAC | 31 | 14 | 5 |
| Explosive | 28 | 4 | 1 |
The zone label hides tougher assignments

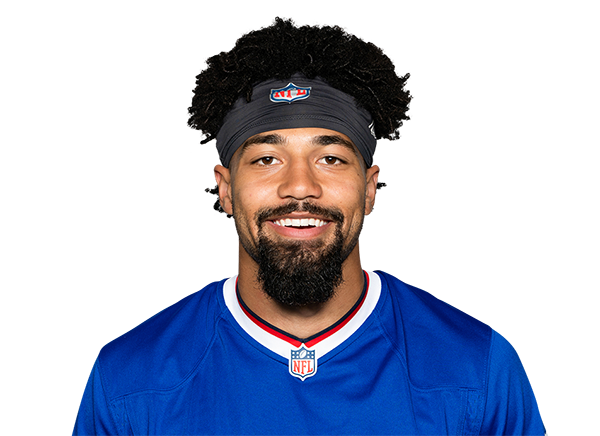
Khalil Shakir
WR ·BUF at MIN
Limited matchup boostMIN’s 91.8% zone rate does not make his short field work easy
Team tgt 19.7% · Air Yds 11.7% · Off snaps 63.7%
| Player production | Opponent shells | |||||||
|---|---|---|---|---|---|---|---|---|
| Metric | Overall | Man (42) | Zone (102) | Shell | Rec / tgt | Yds | DEF YPT / N | Tgt % |
| Yds | 354 | 88 | 229 | Cover 4 | 2 / 2 | 22 | 5.78 / 58 | 27.1% |
| TPRR | 21.1% | 23.8% | 19.6% | Cover 3 | 6 / 9 | 84 | 6.98 / 56 | 26.2% |
| YPRR | 2.02 | 2.10 | 2.25 | Cover 2 | 5 / 5 | 110 | 6.57 / 42 | 19.6% |
Shakir has 16 catches for 229 Yds on 20 zone targets across 102 routes, or 2.25 YPRR. His man YPRR is similar at 2.10. MIN’s 91.8% zone rate sounds inviting until you notice how little the family changes his return. Zone is a coverage label, not a welcome mat.
MIN’s Cover 4 allows 5.78 YPT across 58 targets, ranked eighth. Shakir has only two looks against it, both caught for 22 Yds. Cover 3 is more ordinary at 6.98 allowed, and he has six catches for 84 Yds on nine targets against it. The smaller shell matchups give a more useful read than MIN’s headline zone percentage.
His most targeted area is short right: ten targets, eight catches and 86 Yds. MIN allows just 4.51 YPT there across 39 targets, best in the league. Its weaker overall YAC prevention does not make that location easier to attack. Shakir’s 19.7% team target share remains the stronger reason to trust his involvement.
Explore Khalil Shakir in Route IQ

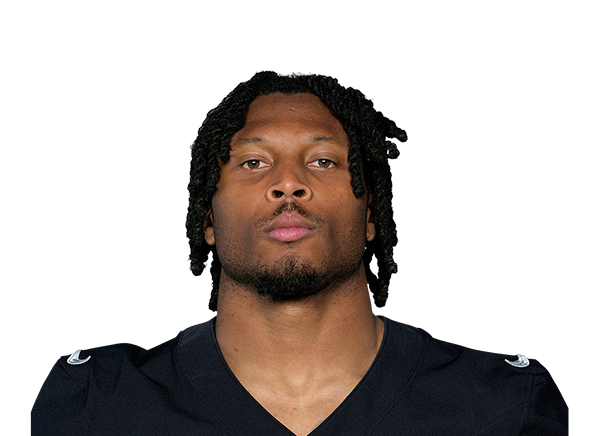
Tre Tucker
WR ·LV at SF
Ceiling faces resistanceSF’s zone frequency comes with a much tougher Cover 3
Team tgt 17.2% · Air Yds 28.2% · Off snaps 66.8%
| Player production | Opponent shells | |||||||
|---|---|---|---|---|---|---|---|---|
| Metric | Overall | Man (69) | Zone (134) | Shell | Rec / tgt | Yds | DEF YPT / N | Tgt % |
| Yds | 474 | 104 | 344 | Cover 3 | 9 / 12 | 138 | 6.01 / 104 | 42.3% |
| TPRR | 18.8% | 21.7% | 21.6% | Cover 6 | 1 / 2 | 13 | 7.07 / 45 | 18.3% |
| YPRR | 1.90 | 1.51 | 2.57 | Cover 1 | 4 / 9 | 87 | 6.61 / 36 | 14.6% |
Tucker has 344 Yds on 134 classified zone routes, or 2.57 YPRR, compared with 104 on 69 man routes, or 1.51. His target rate is almost identical in the two families at 21.6% and 21.7%. More zone has improved the yardage per route in his sample without producing more frequent targets.
SF uses zone on 75.8% of its family sample. Cover 3 accounts for 42.3% of its shell tagged targets and allows only 625 Yds on 104 targets, or 6.01 YPT, ranked sixth. Tucker has nine catches for 138 Yds on 12 Cover 3 looks, so he has shown a useful answer. SF’s fourth ranked explosive reception prevention makes repeating the ceiling a more demanding task.
LV is getting ten in a 52.5 total, which could keep the passing game busy. Tucker has 20 targets over the last three games, an 18.7% share. Cover 6 is more ordinary at 7.07 YPT allowed, but he has only two targets against it. There may be plenty of passing attempts here. SF’s main shells make the useful ones harder to find.
Explore Tre Tucker in Route IQ

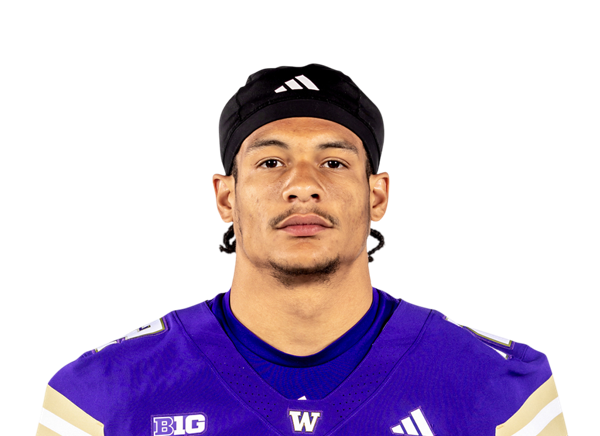
Denzel Boston
WR ·CLE at NO
Zone split needs contextNO’s favorite shell has not supplied his best zone production
Team tgt 21.5% · Air Yds 45.2% · Off snaps 90.1%
| Player production | Opponent shells | |||||||
|---|---|---|---|---|---|---|---|---|
| Metric | Overall | Man (68) | Zone (178) | Shell | Rec / tgt | Yds | DEF YPT / N | Tgt % |
| Yds | 409 | 24 | 328 | Cover 3 | 6 / 12 | 61 | 7.65 / 120 | 50.9% |
| TPRR | 18.4% | 19.1% | 17.4% | Cover 6 | 3 / 6 | 48 | 5.83 / 41 | 17.4% |
| YPRR | 1.42 | 0.35 | 1.84 | Cover 1 | 1 / 9 | 9 | 7.19 / 32 | 13.6% |
Boston has 328 Yds on 178 zone routes, or 1.84 YPRR, against 24 on 68 man routes. NO uses zone on about three quarters of its family sample. That looks like a clean match until you open the shell splits.
Cover 3 is 50.9% of NO’s shell tagged targets. Boston’s response to that shell is six catches for 61 Yds on 12 targets, just 5.08 YPT. NO’s own allowance is 918 Yds on 120 targets, or 7.65 YPT, ranked 21st. The defense offers room, but Boston’s larger zone total has not arrived mainly through that common answer.
Boston still has 53 targets, 45.3% of CLE air Yds and 90.1% of offensive snaps, with 11 targets in his latest game. That workload keeps him relevant. NO’s Cover 6 is tighter at 5.83 YPT allowed, and its most common shell has not supplied his best zone production. I would trust the growing role more than the broad coverage label.
Explore Denzel Boston in Route IQ

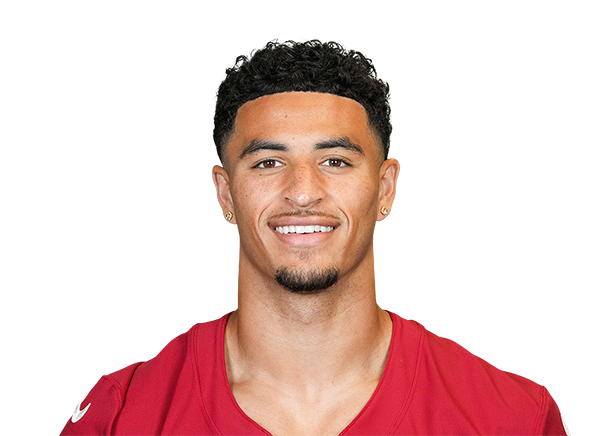
Michael Wilson
WR ·ARI at SEA
Ribs and tough shellsSEA is a substantial change from last week’s receiving environment
Team tgt 25.9% · Air Yds 39.8% · Off snaps 88.5%
| Player production | Opponent shells | |||||||
|---|---|---|---|---|---|---|---|---|
| Metric | Overall | Man (84) | Zone (161) | Shell | Rec / tgt | Yds | DEF YPT / N | Tgt % |
| Yds | 486 | 137 | 290 | Cover 3 | 13 / 24 | 138 | 5.13 / 75 | 29.3% |
| TPRR | 23.2% | 31.0% | 24.8% | Cover 6 | 2 / 3 | 31 | 4.75 / 64 | 25.0% |
| YPRR | 1.48 | 1.63 | 1.80 | Cover 2 | 6 / 8 | 62 | 5.35 / 40 | 15.6% |
Wilson has 30 targets over the last three games and a 25.9% season share. His zone sample is 26 catches for 290 Yds on 40 targets across 161 routes, or 1.80 YPRR. That is only a small improvement on his 1.63 against man. SEA’s 78.5% zone use does not buy him much by itself.
The shells are much harder. SEA allows 385 Yds on 75 Cover 3 targets, or 5.13 YPT, ranked second. Its Cover 6 allows 304 on 64, or 4.75, ranked third. Together those looks account for 54.3% of its shell tagged targets. Wilson has 138 Yds on 24 Cover 3 targets and 31 on three Cover 6 looks. Neither creates an obvious path around the defense.
Wilson remains questionable with broken ribs. Minshew is first on ARI’s depth chart after replacing Brissett against DAL, so I have not used Brissett’s season efficiency as the assumed QB setting. The targets are valuable. SEA ranking first in both downfield and explosive reception prevention makes this a very different assignment from last week.
Explore Michael Wilson in Route IQ
SEA’s two main shells both resist yardage
Defense Yds per target. C3: 385 / 75. C6: 304 / 64. C2: 214 / 40.
| Matchup | Allowed |
|---|---|
| Cover 3 | 5.1333 |
| Cover 6 | 4.75 |
| Cover 2 | 5.35 |
TPRR is targets divided by classified routes. YPRR is receiving Yds divided by classified routes. Family usage and shell tagged target shares are separate historical samples, not future snap probabilities. Defensive shell and field outcomes include all receiving positions. Ranks run from 1 toughest to 32 softest. Season, family and shell totals use separate samples and should not be added together. No betting line or projection is implied by a coverage verdict.
Explore Coverage Engine and Data Lab. Read the Week 8 edition.
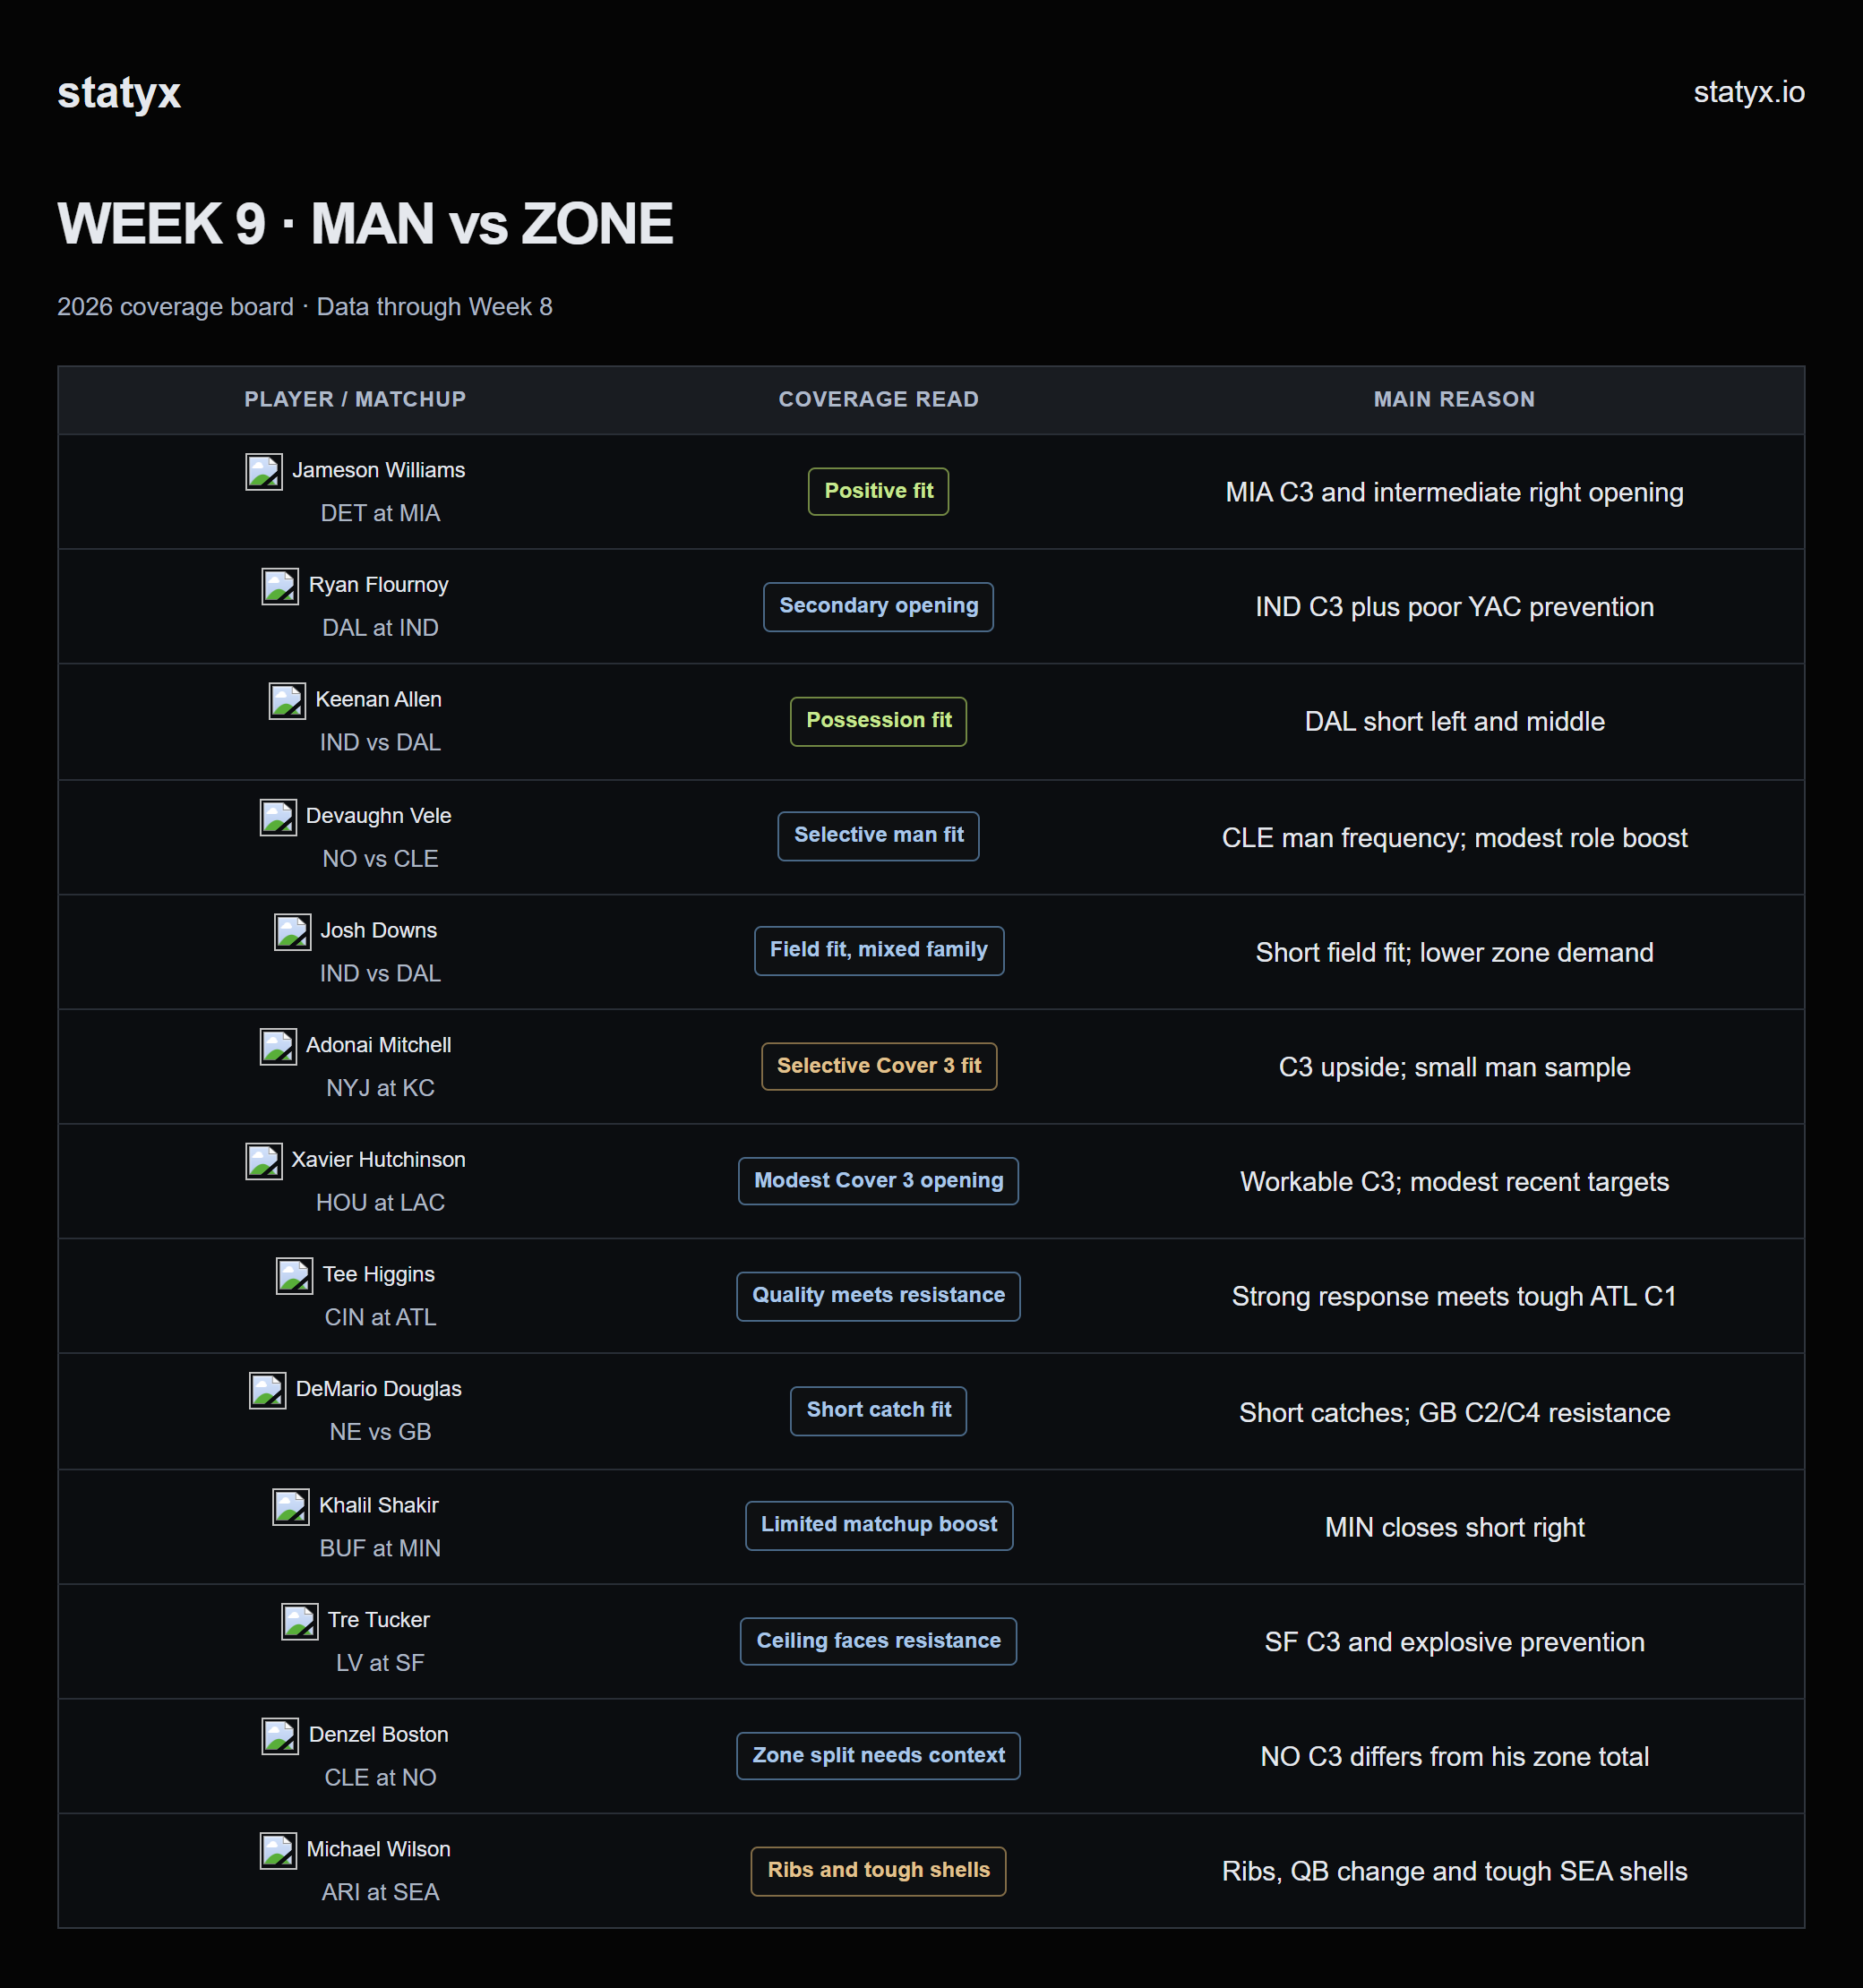
The final coverage board
| Player / matchup | Coverage read |
|---|---|
| Jameson Williams / DET at MIA | Positive fit. MIA C3 and intermediate right opening. |
| Ryan Flournoy / DAL at IND | Secondary opening. IND C3 plus poor YAC prevention. |
| Keenan Allen / IND vs DAL | Possession fit. DAL short left and middle. |
| Devaughn Vele / NO vs CLE | Selective man fit. CLE man frequency; modest role boost. |
| Josh Downs / IND vs DAL | Field fit, mixed family. Short field fit; lower zone demand. |
| Adonai Mitchell / NYJ at KC | Selective Cover 3 fit. C3 upside; small man sample. |
| Xavier Hutchinson / HOU at LAC | Modest Cover 3 opening. Workable C3; modest recent targets. |
| Tee Higgins / CIN at ATL | Quality meets resistance. Strong response meets tough ATL C1. |
| DeMario Douglas / NE vs GB | Short catch fit. Short catches; GB C2/C4 resistance. |
| Khalil Shakir / BUF at MIN | Limited matchup boost. MIN closes short right. |
| Tre Tucker / LV at SF | Ceiling faces resistance. SF C3 and explosive prevention. |
| Denzel Boston / CLE at NO | Zone split needs context. NO C3 differs from his zone total. |
| Michael Wilson / ARI at SEA | Ribs and tough shells. Ribs, QB change and tough SEA shells. |
Published for research and entertainment purposes. Not betting advice.


Discussion
Sign in to join the discussion.
Loading comments…