NFL Week 8 Man vs Zone: The Coverage Label Is Only Half the Matchup
Week 8 WR matchups using Statyx man and zone splits, target demand and coverage shells. 13 receiving reads with five interactive charts.
Get the tools behind this post. Free Statyx account, no card needed.
Sign up free Kaz

CHI has allowed 9.19 Yds per target in Cover 3 and 4.91 in Cover 1. SEA has allowed 4.57 in Cover 3. JSN and Luther Burden play in the same Monday night game, both produce better against zone, and face very different assignments. The coverage label alone would miss that.
This week’s receiving report follows the targets into the actual shell. A player earning looks against man matters. So does whether the opponent gives up the part of the field he uses. Below are thirteen reads built from Statyx’s current role data, classified receiving samples and opponent shell outcomes.
Statyx data through Week 7 · Pulled Oct 27, 11:20 p.m. PDT · Availability checked Oct 28, 12:29 a.m. PDT.
Man responseZone matchupsSecond lookFinal board
Who earns more targets against man?
TPRR calculated from classified targets / routes. Larger man demand does not establish a soft defense.
| Matchup | Man | Zone |
|---|---|---|
| Tate | 31.11111111111111 | 22.5 |
| Washington | 31.70731707317073 | 25.49019607843137 |
| Waddle | 32.35294117647059 | 22.54901960784314 |
| Wilson | 26.41509433962264 | 22.388059701492537 |
The man response: demand first, then the defense

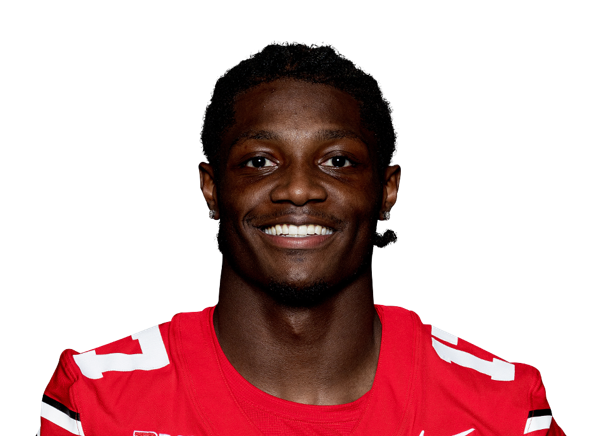
Carnell Tate
WR ·TEN at CIN
Positive fitCIN gives the short game room, even when the deep ball is a tougher sell
| Team tgt % | Air Yds % | Overall YPRR |
|---|---|---|
| 26.2% | 46.9% | 2.00 |
| Type | Rts | Tgt | Rec | Yds | TPRR | YPRR |
|---|---|---|---|---|---|---|
| Man | 45 | 14 | 8 | 108 | 31.1% | 2.40 |
| Zone | 120 | 27 | 21 | 232 | 22.5% | 1.93 |
| Shell | Player rec / tgt | Player YPT | DEF YPT / tgt | DEF tagged tgt % |
|---|---|---|---|---|
| Cover 3 | 14 / 17 | 9.94 | 7.78 / 55 | 26.6% |
| Cover 1 | 6 / 13 | 6.15 | 7.90 / 52 | 25.1% |
| Cover 6 | 3 / 7 | 4.57 | 6.66 / 41 | 19.8% |
Tate’s man target rate is 31.1%: 14 looks on 45 classified routes. Eight catches gained 108 Yds. Against zone, he has 27 targets on 120 routes, with 21 catches for 232 Yds. The stronger man demand matters against CIN’s 40.6% man tendency. This is also an established offensive role, with 26.2% of TEN’s targets and 46.9% of its air Yds.
CIN’s Cover 1 has conceded 411 Yds on 52 targets, or 7.90 per target, and its Cover 3 has allowed 7.78 across 55 targets. Tate’s own Cover 3 sample is 14 catches for 169 Yds on 17 targets. There is support on both sides of that matchup. The cleaner field overlap is shorter: CIN allows 7.77 Yds per target to the short left, where Tate has caught 11 of 14 for 96 Yds.
CIN ranks third toughest on downfield allowance but last on YAC per catch allowed, at 6.66. That makes a catch and run case more convincing than simply expecting bombs. TEN is a 10.5 point underdog in the current 47 total, which supports the need to throw. Cam Ward’s current 2026 context is negative 0.173 EPA per dropback, so this is a useful receiving matchup rather than a sudden promotion of the whole passing offense.

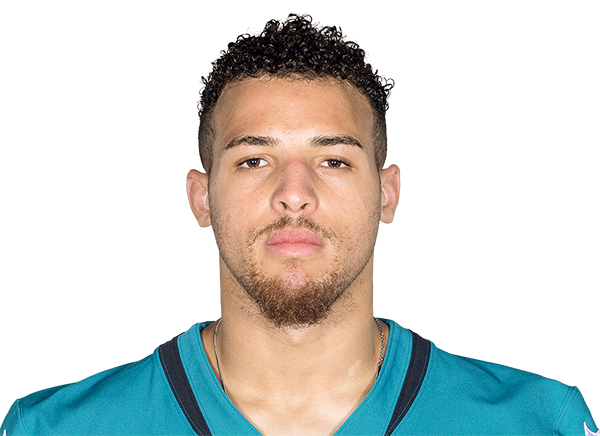
Parker Washington
WR ·JAX vs IND
Positive fitIND gives him workable answers in Cover 1 and Cover 3
| Team tgt % | Air Yds % | Overall YPRR |
|---|---|---|
| 25.8% | 41.2% | 2.39 |
| Type | Rts | Tgt | Rec | Yds | TPRR | YPRR |
|---|---|---|---|---|---|---|
| Man | 41 | 13 | 6 | 113 | 31.7% | 2.76 |
| Zone | 102 | 26 | 17 | 257 | 25.5% | 2.52 |
| Shell | Player rec / tgt | Player YPT | DEF YPT / tgt | DEF tagged tgt % |
|---|---|---|---|---|
| Cover 3 | 11 / 18 | 10.22 | 7.78 / 65 | 29.9% |
| Cover 1 | 6 / 13 | 8.69 | 7.86 / 42 | 19.4% |
| Cover 2 | 0 / 1 | 0.00 | 6.83 / 30 | 13.8% |
Washington earns a target on 31.7% of his classified man routes, compared with 25.5% against zone. His man sample is six catches for 113 Yds on 13 targets across 41 routes; the zone sample is 17 catches for 257 Yds on 26 targets across 102. A 25.8% team target share and 41.2% air Yds share keep the coverage case attached to a substantial role.
IND’s man tendency is 40.5%. Cover 1 has allowed 330 Yds on 42 targets, or 7.86 per target, and Cover 3 allows 7.78 on 65. Washington has 184 Yds on 18 Cover 3 targets, with eleven catches. Neither of those common answers forces him into an unfamiliar job.
The Colts also allow 5.90 YAC per catch, ranked 29th for prevention. That gives the underneath part of his game something to work with, even though IND has been considerably better at limiting downfield Yds per target. The appeal is a receiver who can earn the throw and find useful space afterward, rather than one isolated deep catch doing all the work.

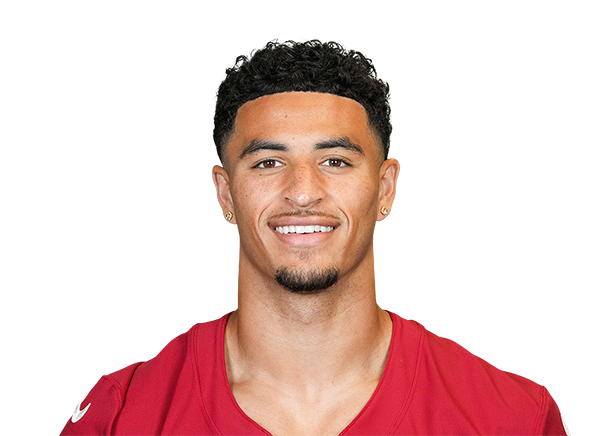
Michael Wilson
WR ·ARI at DAL
Volume backed fitDAL offers a workable Cover 3 assignment, with volume doing the heavy lifting
| Team tgt % | Air Yds % | Overall YPRR |
|---|---|---|
| 24.3% | 35.6% | 1.32 |
| Type | Rts | Tgt | Rec | Yds | TPRR | YPRR |
|---|---|---|---|---|---|---|
| Man | 67 | 21 | 11 | 107 | 31.3% | 1.60 |
| Zone | 146 | 33 | 22 | 237 | 22.6% | 1.62 |
| Shell | Player rec / tgt | Player YPT | DEF YPT / tgt | DEF tagged tgt % |
|---|---|---|---|---|
| Cover 3 | 12 / 20 | 6.45 | 7.59 / 74 | 35.1% |
| Cover 1 | 11 / 19 | 5.37 | 7.00 / 48 | 22.8% |
| Cover 4 | 5 / 9 | 4.67 | 6.31 / 39 | 18.5% |
Wilson earns targets on 31.3% of his classified man routes: 21 looks on 67 routes. Eleven catches gained 107 Yds. Against zone, 33 targets on 146 routes produced 22 catches for 237 Yds. The man target demand is stronger, but Yds per route are almost level at 1.60 and 1.62. This is a demand story before it is an efficiency story.
DAL plays zone on 67.2% of its family sample. Its Cover 3 has allowed 562 Yds on 74 targets, or 7.59 per target, and accounts for 35.1% of its shell tagged targets. Wilson’s separate Cover 3 response is twelve catches for 129 Yds on twenty targets. Cover 1 allows 7.00 Yds per target across 48 throws; he has eleven catches for 102 Yds on nineteen targets against it. Both shells offer a workable assignment, without turning his modest returns into an imaginary breakout.
The broader role is substantial: 24.3% of ARI’s targets and 35.6% of its air Yds. DAL allows 7.69 Yds per target to the short right, where Wilson has caught eleven of fifteen for 70 Yds. That gives the shorter completions a place in the case. ARI is a 6.5 point underdog in the current 54.5 total. The appeal is steady involvement in a game that could keep ARI throwing, rather than needing Wilson to become a deep ball specialist overnight.

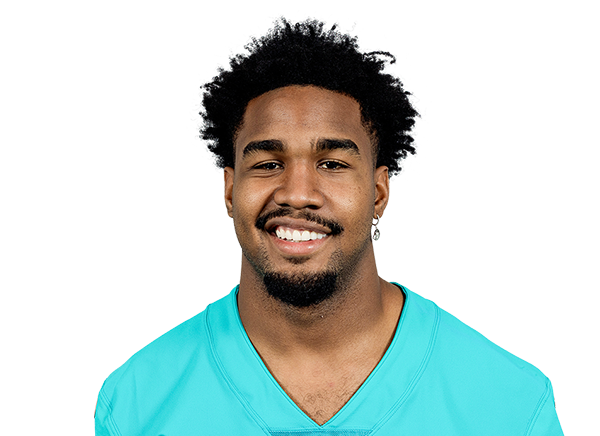
Jaylen Waddle
WR ·DEN vs KC
Health first, mixed fitThe man demand is there. KC’s Cover 1 has been much less generous
| Team tgt % | Air Yds % | Overall YPRR |
|---|---|---|
| 23.0% | 37.0% | 1.48 |
| Type | Rts | Tgt | Rec | Yds | TPRR | YPRR |
|---|---|---|---|---|---|---|
| Man | 34 | 11 | 6 | 74 | 32.4% | 2.18 |
| Zone | 102 | 23 | 14 | 172 | 22.5% | 1.69 |
| Shell | Player rec / tgt | Player YPT | DEF YPT / tgt | DEF tagged tgt % |
|---|---|---|---|---|
| Cover 3 | 7 / 14 | 4.64 | 8.54 / 59 | 28.2% |
| Cover 4 | 5 / 7 | 14.43 | 6.10 / 52 | 24.9% |
| Cover 1 | 4 / 9 | 4.11 | 4.55 / 33 | 15.8% |
Waddle’s 11 targets on 34 man routes produce a 32.4% target rate. His zone rate is 22.5%, from 23 looks on 102 routes. The demand against man fits KC’s 44.4% tendency, but the output is more modest: 74 Yds against man and 172 against zone.
KC’s Cover 1 has allowed 150 Yds on 33 targets, just 4.55 per target. Waddle has four catches for 37 Yds on nine Cover 1 targets. Cover 3 is the opening in the defense, allowing 8.54 across 59 targets, but Waddle’s own response is seven catches for 65 Yds on 14 targets. The defense’s weakest shell and his best production have not lined up neatly.
He exited Week 7 with a chest injury and the current Statyx depth report lists him questionable. That keeps this behind the healthier receiving options. Even if cleared, the argument is target involvement against man, not a demonstrated explosive advantage over KC.

Garrett Wilson
WR ·NYJ vs LV
Role holds, modest boostGood man production meets an opponent that mostly plays zone
| Team tgt % | Air Yds % | Overall YPRR |
|---|---|---|
| 25.9% | 36.3% | 2.01 |
| Type | Rts | Tgt | Rec | Yds | TPRR | YPRR |
|---|---|---|---|---|---|---|
| Man | 53 | 14 | 13 | 162 | 26.4% | 3.06 |
| Zone | 134 | 30 | 19 | 229 | 22.4% | 1.71 |
| Shell | Player rec / tgt | Player YPT | DEF YPT / tgt | DEF tagged tgt % |
|---|---|---|---|---|
| Cover 3 | 7 / 11 | 7.18 | 6.91 / 68 | 29.7% |
| Cover 1 | 9 / 10 | 10.80 | 7.24 / 38 | 16.6% |
| Cover 2 | 6 / 8 | 6.00 | 8.19 / 32 | 14.0% |
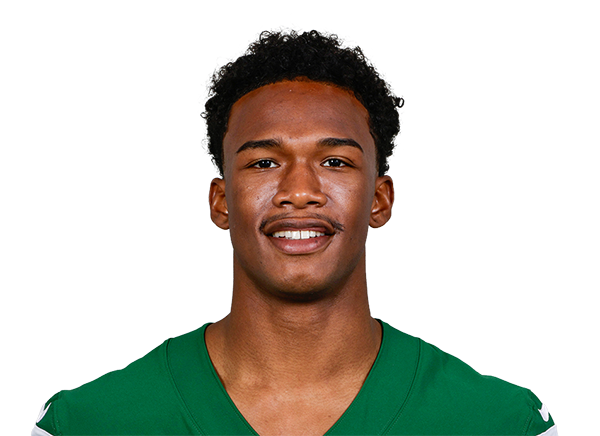
Wilson has caught 13 of 14 classified man targets for 162 Yds across 53 routes. That is 3.06 Yds per route, against 1.71 in zone. His target rates are closer together, at 26.4% and 22.4%, so much of the advantage has come from what happens after the throw rather than a dramatic change in demand.
LV plays zone on 66.3% of its classified family sample. Its Cover 1 allows 7.24 Yds per target, compared with 6.91 in Cover 3. Wilson’s Cover 1 return is nine catches for 108 Yds on ten targets; his Cover 3 return is seven for 79 on eleven. The attractive man response is relevant, but it is not the coverage he should be promised on every drive.
LV’s 6.05 YAC per catch allowed, ranked 30th, offers the more general opening. Wilson still owns 25.9% of NYJ’s targets. That combination supports the role while keeping the coverage bump measured. Calling this a pure man matchup would be doing the sales pitch before reading the defense.
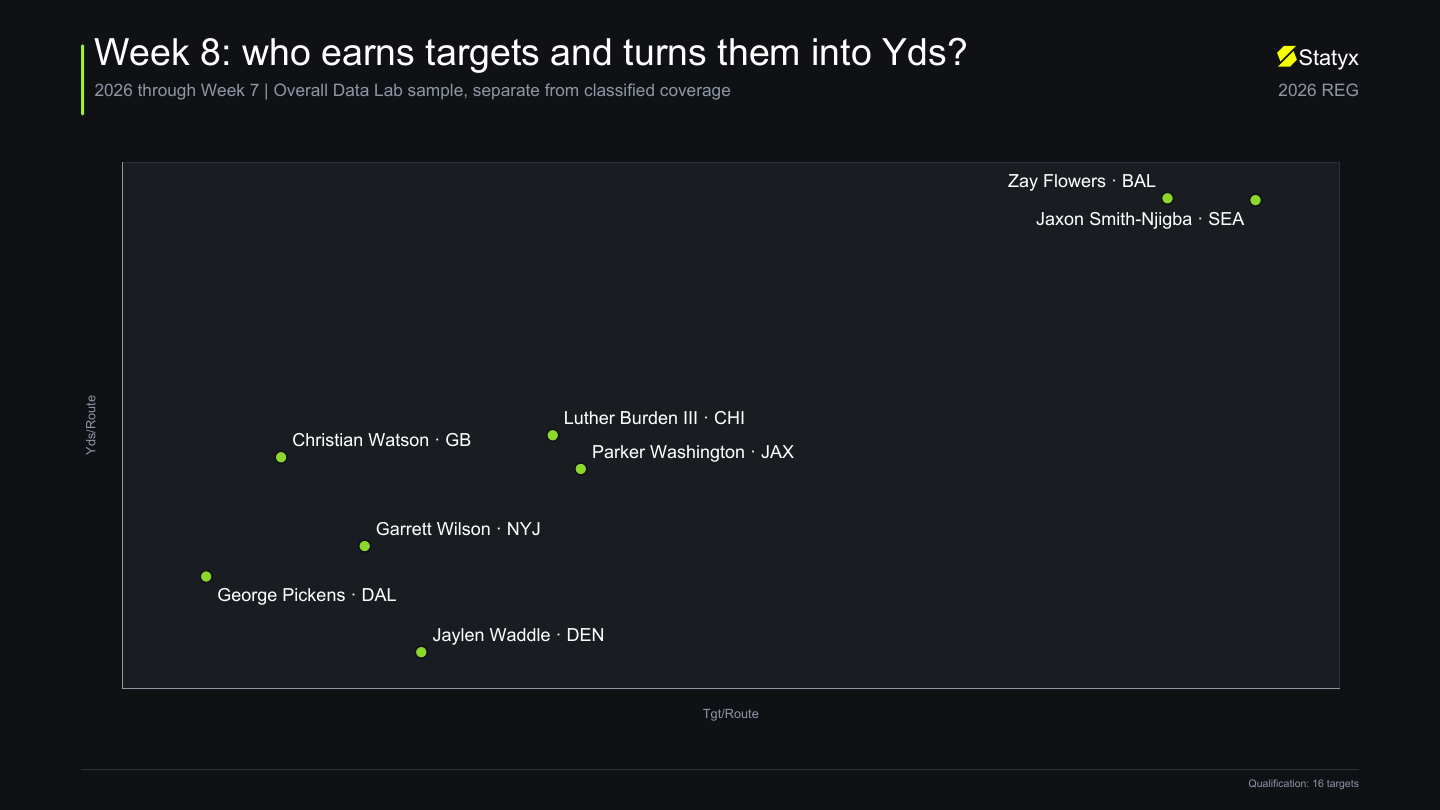
Zone production meets the actual shell
One game, opposite Cover 3 tests
CHI: 478 Yds / 52 targets. SEA: 297 / 65. Defensive outcomes include all receiving positions.
| Matchup | Allowed |
|---|---|
| CHI | 9.192307692307692 |
| SEA | 4.569230769230769 |
Zone production needs a matchup check
Player Yds per classified zone route; route counts remain visible in the player tables.
| Matchup | Zone |
|---|---|
| JSN | 3.762295081967213 |
| Flowers | 4.48 |
| Watson | 3.19375 |
| III | 3 |

Jaxon Smith-Njigba
WR ·SEA vs CHI
Strong fitCHI’s Cover 3 gives his volume a clear place to land
| Team tgt % | Air Yds % | Overall YPRR |
|---|---|---|
| 36.3% | 51.1% | 3.72 |
| Type | Rts | Tgt | Rec | Yds | TPRR | YPRR |
|---|---|---|---|---|---|---|
| Man | 46 | 18 | 12 | 151 | 39.1% | 3.28 |
| Zone | 122 | 39 | 32 | 459 | 32.0% | 3.76 |
| Shell | Player rec / tgt | Player YPT | DEF YPT / tgt | DEF tagged tgt % |
|---|---|---|---|---|
| Cover 1 | 5 / 12 | 5.58 | 4.91 / 54 | 26.6% |
| Cover 3 | 17 / 21 | 11.43 | 9.19 / 52 | 25.6% |
| Cover 2 | 12 / 14 | 12.57 | 9.05 / 39 | 19.2% |
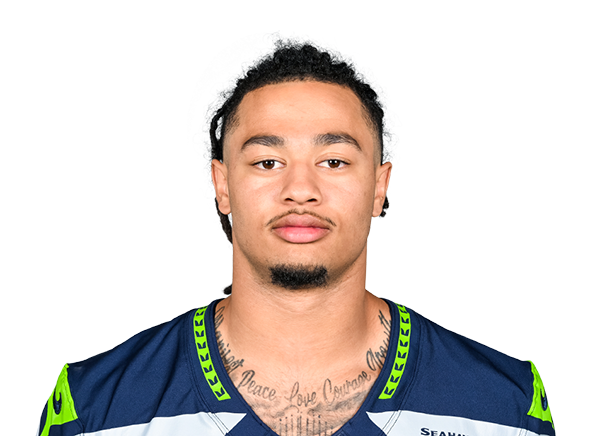
JSN owns 36.3% of SEA’s targets and 51.1% of its air Yds. That is the foundation before any matchup adjustment. His classified zone sample adds 39 targets on 122 routes, with 32 catches for 459 Yds, or 3.76 Yds per route. Against man, he has 151 Yds on 46 routes. Both families have produced; zone provides the larger sample.
CHI’s Cover 3 has conceded 478 Yds on 52 targets, a league worst 9.19 per target in this shell. Its Cover 1 is much tighter at 4.91. JSN has caught 17 of 21 Cover 3 targets for 240 Yds, compared with five of twelve for 67 in Cover 1. The stronger overlap is unusually clean: productive receiver, vulnerable shell, meaningful sample.
Cover 2 offers another path. CHI allows 9.05 Yds per target across 39 throws; JSN has twelve catches for 176 Yds on fourteen targets against it. This is a real matchup upgrade attached to an already dominant role, rather than trying to manufacture a sleeper out of three interesting catches.

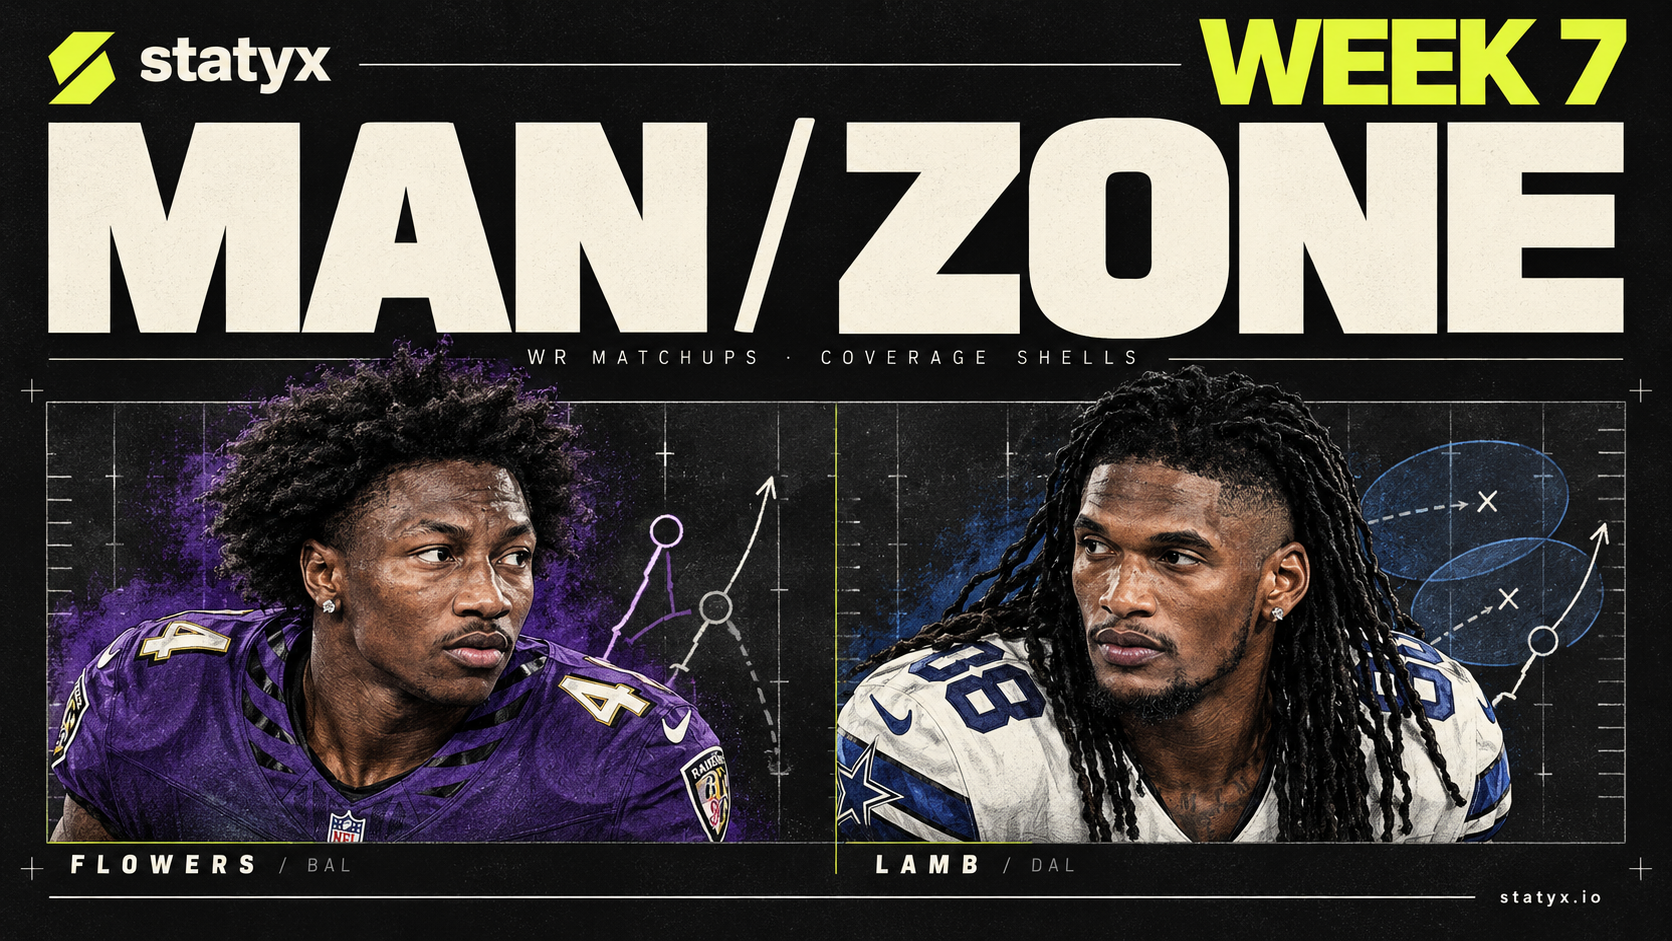
Zay Flowers
WR ·BAL at BUF
Positive zone fitBUF’s Cover 3 and Cover 4 keep the case alive beyond one hot split
| Team tgt % | Air Yds % | Overall YPRR |
|---|---|---|
| 31.4% | 32.9% | 3.73 |
| Type | Rts | Tgt | Rec | Yds | TPRR | YPRR |
|---|---|---|---|---|---|---|
| Man | 41 | 13 | 8 | 140 | 31.7% | 3.41 |
| Zone | 100 | 34 | 30 | 448 | 34.0% | 4.48 |
| Shell | Player rec / tgt | Player YPT | DEF YPT / tgt | DEF tagged tgt % |
|---|---|---|---|---|
| Cover 3 | 18 / 21 | 11.90 | 6.97 / 78 | 32.4% |
| Cover 4 | 5 / 6 | 19.00 | 8.06 / 54 | 22.4% |
| Cover 2 | 7 / 8 | 8.25 | 6.91 / 32 | 13.3% |
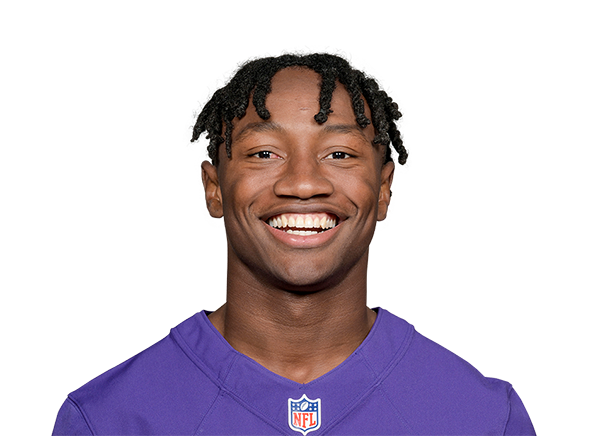
Flowers has 30 catches for 448 Yds on 34 classified zone targets across 100 routes. The 34.0% target rate and 4.48 Yds per route make zone a major source of both demand and production. His man sample remains useful at 140 Yds on 41 routes, so the case does not require BAL to get its preferred coverage every time.
BUF plays zone on 67.2% of its family sample. Its most frequent shell in the tagged target sample is Cover 3, allowing 6.97 Yds per target across 78 throws. Flowers has 18 catches for 250 Yds on 21 Cover 3 targets. Cover 4 is softer at 8.06 allowed per target; he has 114 Yds on six targets against it. That second sample is small, but the main Cover 3 production gives the read a firmer base.
His 31.4% team target share keeps him central to BAL’s passing game. The latest Statyx injury feed, citing NFL Network’s Ian Rapoport, reports that Lamar Jackson is expected to return against BUF. He remains listed questionable, so Flowers’ favorable receiving fit gets a better quarterback outlook without assuming final clearance.

George Pickens
WR ·DAL vs ARI
Useful zone openingARI’s Cover 3 fits his established production
| Team tgt % | Air Yds % | Overall YPRR |
|---|---|---|
| 21.9% | 30.6% | 1.86 |
| Type | Rts | Tgt | Rec | Yds | TPRR | YPRR |
|---|---|---|---|---|---|---|
| Man | 45 | 10 | 6 | 56 | 22.2% | 1.24 |
| Zone | 188 | 43 | 29 | 409 | 22.9% | 2.18 |
| Shell | Player rec / tgt | Player YPT | DEF YPT / tgt | DEF tagged tgt % |
|---|---|---|---|---|
| Cover 4 | 6 / 9 | 13.22 | 6.02 / 56 | 27.3% |
| Cover 3 | 13 / 21 | 8.67 | 8.91 / 44 | 21.5% |
| Cover 6 | 2 / 3 | 10.33 | 5.80 / 44 | 21.5% |
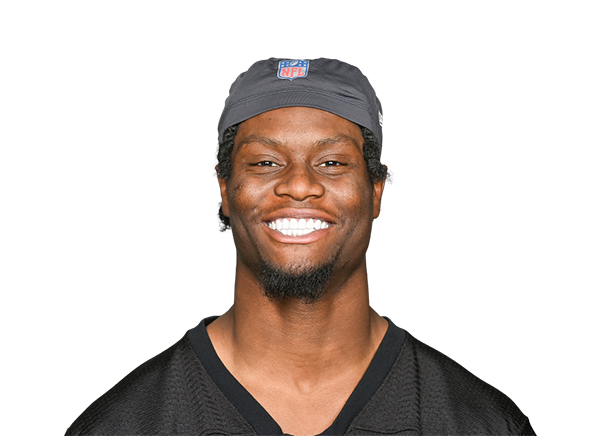
Pickens has 43 targets on 188 classified zone routes, producing 29 catches for 409 Yds. His target rate is almost identical across the two families, at 22.9% against zone and 22.2% against man. The yardage is different: 2.18 Yds per zone route versus 1.24 against man. More zone does not automatically mean more targets, but it has meant better returns.
ARI’s zone tendency is 78.3%. Its Cover 3 allows 8.91 Yds per target across 44 throws, ranked 30th for prevention, and Pickens has thirteen catches for 182 Yds on 21 targets against that shell. The broader defense has allowed an explosive catch on 17.2% of receptions, ranked 31st. There is an identifiable yardage opening rather than just a friendly team logo.
ARI’s Cover 4 and Cover 6 have been considerably tougher, allowing 6.02 and 5.80 Yds per target. Pickens has still gained 119 Yds on nine Cover 4 targets. His 21.9% team target share is smaller than Lamb’s, so this is a useful WR2 or flex angle built on efficiency, not a claim that he has become DAL’s first option.

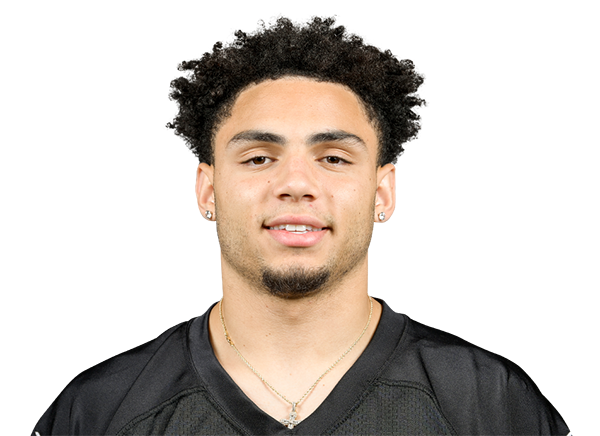
Drake London
WR ·ATL at TB
Quality through resistanceTB plays his preferred family but makes him earn the main shell
| Team tgt % | Air Yds % | Overall YPRR |
|---|---|---|
| 29.2% | 43.9% | 3.03 |
| Type | Rts | Tgt | Rec | Yds | TPRR | YPRR |
|---|---|---|---|---|---|---|
| Man | 35 | 7 | 4 | 95 | 20.0% | 2.71 |
| Zone | 143 | 44 | 34 | 521 | 30.8% | 3.64 |
| Shell | Player rec / tgt | Player YPT | DEF YPT / tgt | DEF tagged tgt % |
|---|---|---|---|---|
| Cover 3 | 20 / 26 | 12.73 | 6.11 / 122 | 48.4% |
| Cover 4 | 7 / 10 | 8.10 | 4.35 / 43 | 17.1% |
| Cover 2 | 5 / 10 | 7.50 | 9.77 / 35 | 13.9% |
London has 44 classified zone targets on 143 routes, with 34 catches for 521 Yds. That is a 30.8% target rate and 3.64 Yds per route. Only seven targets came against man across 35 routes. TB’s 76.0% zone tendency puts the larger and stronger part of his sample in play.
The catch is Cover 3. It accounts for 48.4% of TB’s shell tagged targets and allows just 6.11 Yds per target across 122 throws. London’s own response is excellent: twenty catches for 331 Yds on 26 targets. TB’s Cover 4 is tighter again, at 4.35 allowed per target across 43. London can win this assignment, but the defense has not been handing those Yds out.
Cover 2 is TB’s weaker answer at 9.77 Yds allowed per target, although it makes up only 13.9% of this tagged target sample. London’s 29.2% team share and 43.9% air Yds share give him the opportunity to work through the tougher looks. Back the receiver’s quality here without presenting the whole zone defense as a clearance sale.

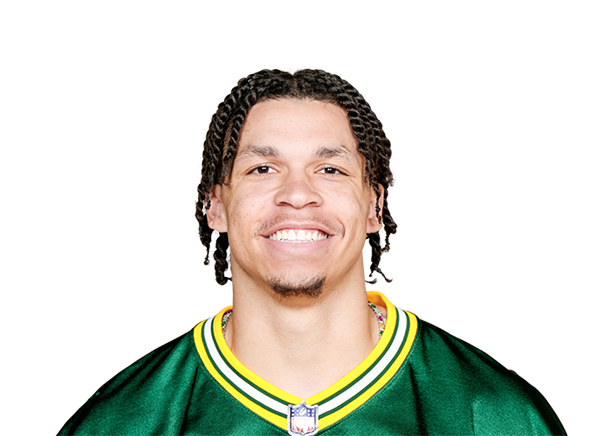
Christian Watson
WR ·GB vs CAR
Ceiling faces resistanceHis zone split is excellent. CAR’s main shells are a different assignment
| Team tgt % | Air Yds % | Overall YPRR |
|---|---|---|
| 21.3% | 30.6% | 2.45 |
| Type | Rts | Tgt | Rec | Yds | TPRR | YPRR |
|---|---|---|---|---|---|---|
| Man | 43 | 9 | 6 | 28 | 20.9% | 0.65 |
| Zone | 160 | 37 | 24 | 511 | 23.1% | 3.19 |
| Shell | Player rec / tgt | Player YPT | DEF YPT / tgt | DEF tagged tgt % |
|---|---|---|---|---|
| Cover 3 | 10 / 20 | 12.20 | 5.17 / 98 | 48.0% |
| Cover 1 | 5 / 9 | 4.00 | 6.28 / 25 | 12.2% |
| Cover 4 | 4 / 7 | 7.43 | 4.84 / 25 | 12.2% |
Watson’s split is striking: 511 Yds on 160 classified zone routes, versus 28 on 43 man routes. His zone target rate is 23.1%, compared with 20.9% against man. The big swing has been yardage per opportunity, not an overwhelming difference in how often the ball finds him.
CAR plays zone on 76.6% of its family sample, but its Cover 3 allows only 5.17 Yds per target across 98 throws, third toughest. Watson has 244 Yds on twenty Cover 3 targets, so he has shown the right receiving skill. The matchup still asks him to beat a defense that has contained the same shell well. CAR’s Cover 4 allows 4.84 Yds per target across 25 targets, also third toughest.
CAR ranks second in explosive catch prevention and second in YAC allowed per catch. That is a considerable change from the kind of opponent that lets a zone specialist turn routine catches into fireworks. Matthew Golden’s shoulder and foot issues could redistribute work, but his Tuesday DNP estimate does not establish an absence. Watson remains a ceiling play with genuine resistance, rather than an automatic upgrade from the zone rate.

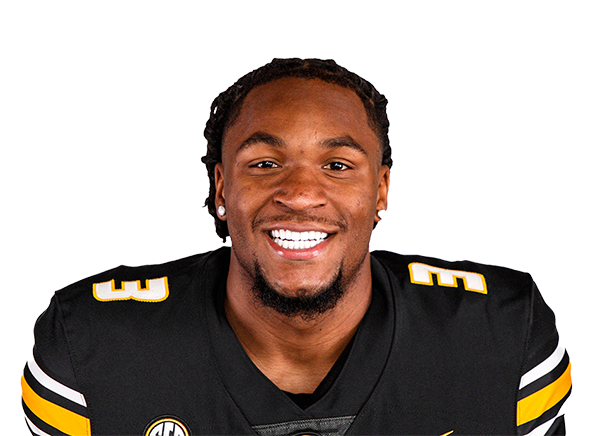
Luther Burden III
WR ·CHI at SEA
Tough fitSEA has been closing the same zone windows that drive his production
| Team tgt % | Air Yds % | Overall YPRR |
|---|---|---|
| 21.0% | 26.1% | 2.56 |
| Type | Rts | Tgt | Rec | Yds | TPRR | YPRR |
|---|---|---|---|---|---|---|
| Man | 32 | 5 | 3 | 41 | 15.6% | 1.28 |
| Zone | 124 | 33 | 25 | 372 | 26.6% | 3.00 |
| Shell | Player rec / tgt | Player YPT | DEF YPT / tgt | DEF tagged tgt % |
|---|---|---|---|---|
| Cover 3 | 8 / 14 | 7.79 | 4.57 / 65 | 29.3% |
| Cover 6 | 5 / 6 | 10.83 | 4.48 / 60 | 27.0% |
| Cover 2 | 6 / 7 | 18.29 | 5.58 / 33 | 14.9% |
Burden has 372 Yds on 124 classified zone routes, exactly 3.00 Yds per route. His zone target rate is 26.6%, with 33 looks, versus five targets on 32 man routes. Zone has supplied almost all of the meaningful receiving sample. SEA’s 80.7% zone tendency initially looks like good news.
The shell outcomes reverse that first impression. SEA allows 4.57 Yds per target in Cover 3 across 65 throws and 4.48 in Cover 6 across sixty. Those two shells account for 56.3% of its tagged target sample. Burden has 109 Yds on fourteen Cover 3 targets and 65 on six Cover 6 targets, useful production but not a reason to ignore the defense.
SEA also ranks first for explosive catch prevention, first on downfield allowance and third on YAC containment. Burden has played well. The opponent has been removing the very routes to a ceiling that make his season split look so attractive. A high zone rate can point toward a crowded room, not an open door.
ARI’s zone shells give different answers
Same defensive sample and receiving population. Usage is tagged target share, not a future snap projection.
| Matchup | Allowed |
|---|---|
| Cover 4 | 6.017857142857143 |
| Cover 3 | 8.909090909090908 |
| Cover 6 | 5.795454545454546 |
Two numbers that need a second look

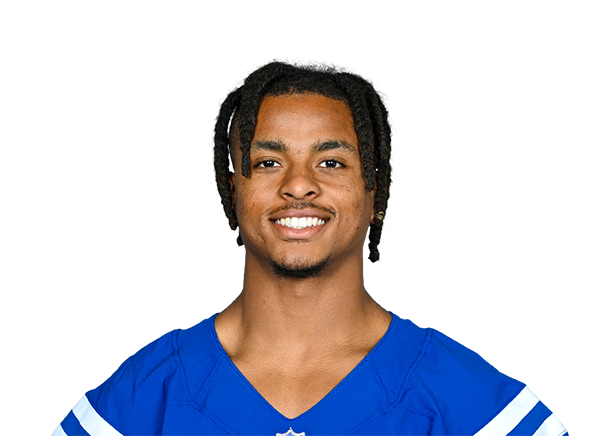
Josh Downs
WR ·IND at JAX
Demand over ceilingJAX’s soft Cover 4 is not yet a demonstrated Downs strength
| Team tgt % | Air Yds % | Overall YPRR |
|---|---|---|
| 20.4% | 28.5% | 1.27 |
| Type | Rts | Tgt | Rec | Yds | TPRR | YPRR |
|---|---|---|---|---|---|---|
| Man | 51 | 17 | 11 | 126 | 33.3% | 2.47 |
| Zone | 150 | 20 | 12 | 158 | 13.3% | 1.05 |
| Shell | Player rec / tgt | Player YPT | DEF YPT / tgt | DEF tagged tgt % |
|---|---|---|---|---|
| Cover 3 | 8 / 13 | 8.15 | 6.96 / 56 | 26.5% |
| Cover 4 | 2 / 7 | 3.14 | 9.05 / 44 | 20.9% |
| Cover 1 | 6 / 14 | 6.21 | 7.14 / 42 | 19.9% |
Downs draws targets on 33.3% of his classified man routes but just 13.3% against zone. His 17 man targets on 51 routes produced eleven catches for 126 Yds. Twenty zone targets on 150 routes produced twelve catches for 158. The opportunity argument is clearly stronger when the defense plays man.
JAX’s Cover 4 has allowed 9.05 Yds per target across 44 throws, worst in that shell. Downs has two catches for 22 Yds on seven Cover 4 targets. His better shell production is 106 Yds on thirteen Cover 3 targets, where JAX allows a middle of the league 6.96 per target. The matchup has a vulnerability, but this receiver has not consistently been the one turning that vulnerability into Yds. Keep him in a PPR volume conversation, rather than upgrading him solely on the Cover 4 rank.

Denzel Boston
WR ·CLE at PIT
Selective openingThe zone headline hides how much came against one smaller shell sample
| Team tgt % | Air Yds % | Overall YPRR |
|---|---|---|
| 20.3% | 45.0% | 1.51 |
| Type | Rts | Tgt | Rec | Yds | TPRR | YPRR |
|---|---|---|---|---|---|---|
| Man | 65 | 13 | 3 | 24 | 20.0% | 0.37 |
| Zone | 147 | 23 | 14 | 300 | 15.6% | 2.04 |
| Shell | Player rec / tgt | Player YPT | DEF YPT / tgt | DEF tagged tgt % |
|---|---|---|---|---|
| Cover 3 | 5 / 11 | 5.55 | 5.34 / 87 | 35.2% |
| Cover 4 | 7 / 8 | 14.62 | 5.78 / 54 | 21.9% |
| Cover 2 | 3 / 4 | 32.00 | 8.34 / 32 | 13.0% |
Boston has 300 Yds on 147 classified zone routes and just 24 on 65 man routes. That looks like an obvious fit against PIT’s 76.9% zone tendency. His separate shell sample includes 128 Yds on only four Cover 2 targets. His larger Cover 3 sample is five catches for 61 Yds on eleven targets.
PIT’s Cover 3 has allowed 5.34 Yds per target across 87 throws, fourth toughest, and Cover 4 allows 5.78 across 54. Cover 2 is the opening at 8.34 allowed per target, but it represents only 13.0% of the tagged target sample. Boston can connect on a big play, particularly with 45.0% of CLE’s air Yds. The evidence points toward a selective ceiling path, not a broad zone mismatch. Four targets should not be asked to carry the whole article.
The Cover 3 label does not set the difficulty
Opponent receiving Yds per target; all receiving positions. Samples: CIN55, IND65, CAR98, SEA65.
| Matchup | Allowed |
|---|---|
| CIN | 7.7818 |
| IND | 7.7846 |
| CAR | 5.1735 |
| SEA | 4.5692 |
Explore Route IQ, Coverage Engine and Data Lab. Read the previous coverage edition.
The final coverage board
Final coverage board
Swipe to compare every column.
| Carnell Tate | Positive fit | TEN at CIN |
| Parker Washington | Positive fit | JAX vs IND |
| Michael Wilson | Volume backed fit | ARI at DAL |
| Jaylen Waddle | Health first, mixed fit | DEN vs KC |
| Garrett Wilson | Role holds, modest boost | NYJ vs LV |
| Jaxon Smith-Njigba | Strong fit | SEA vs CHI |
| Zay Flowers | Positive zone fit | BAL at BUF |
| George Pickens | Useful zone opening | DAL vs ARI |
| Drake London | Quality through resistance | ATL at TB |
| Christian Watson | Ceiling faces resistance | GB vs CAR |
| Luther Burden III | Tough fit | CHI at SEA |
| Josh Downs | Demand over ceiling | IND at JAX |
| Denzel Boston | Selective opening | CLE at PIT |
Published for research and entertainment purposes. Not betting advice.
Discussion
Sign in to join the discussion.
Loading comments…