NFL Week 8 Start/Sit: Follow the Work, Then Test the Matchup
Week 8 PPR start/sit decisions using Statyx Route IQ, Rush IQ, quarterback efficiency and one sortable fantasy points allowed table covering all 32 defenses.
Get the tools behind this post. Free Statyx account, no card needed.
Sign up free Kaz
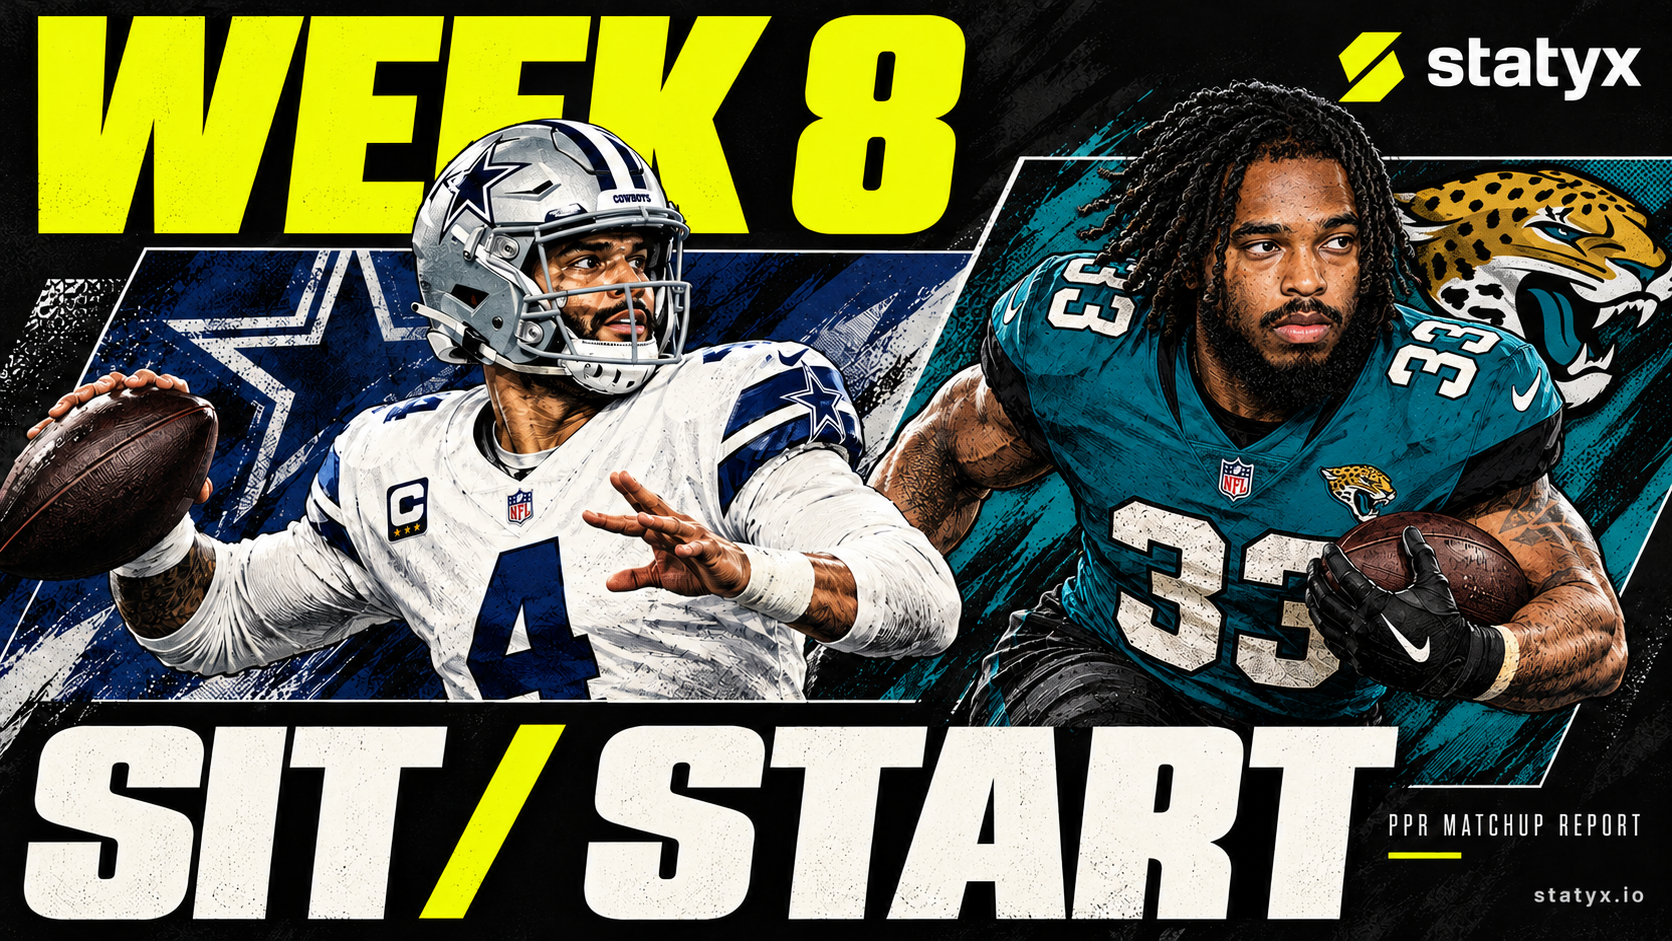
Prescott gets ARI, a defense with 17 passing TDs allowed in seven games. Warren can attack CLE's left edge, and Tuten faces an IND front giving up 6.5 Yds per carry across the three left-side lanes. Those are lineup decisions with a specific path to points.
The tougher choices come in DET. Goff has played well enough to trust most weeks, but MIN is allowing the fewest QB and TE points in this scoring sample. On the other side, Hockenson gets a defense that has already conceded 10 receiving TDs to TEs. Follow the work first, then ask whether the defense makes that work easier.
Statyx data through Week 7 · Pulled Oct 27, 11:20 p.m. PDT · Availability checked Oct 28, 12:29 a.m. PDT.
QuarterbacksRunning backsReceiversTight endsFantasy points allowedFinal board
Quarterbacks
The matchup split for quarterback replacements
Defensive EPA per dropback allowed. Higher is worse for the defense. This is observed efficiency, not a fantasy projection.
| Matchup | Allowed |
|---|---|
| ARI | 0.2739 |
| MIA | 0.3115 |
| DAL | 0.2713 |
| MIN | -0.2157 |

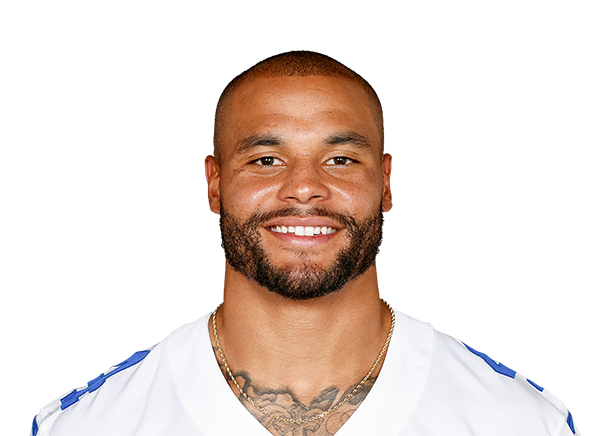
Dak Prescott
QB ·DAL vs ARI · QB1
StartThe best part of this matchup is not the total.
| Matchup metric | Value |
|---|---|
| Opponent QB PPR / G | 19.5 · #29/32 |
| Profile EPA / DB | +0.168 |
| Catchable rate | 73.0% |
| ARI pass TD allowed | 17 in 7 G |
ARI has allowed 17 passing TDs in seven games and +0.274 EPA per dropback. Prescott brings a 73.0% catchable rate and +0.168 EPA per dropback in his matchup profile. That is a useful combination: an offense that can deliver accurate throws against a defense that keeps turning completions into valuable plays.
The field map gives the matchup some shape. ARI has allowed roughly 10.2 to 10.9 Yds per attempt in each intermediate direction, across samples of 17 to 21 throws. DAL does not need to make every possession a deep shot to move the ball. The 54.5 total is the highest of the games featured here, with DAL favored by 6.5. This is where I would take an efficient passing environment over Goff's much tougher opponent.
Lineup call: Start over Goff, Brissett or Darnold.

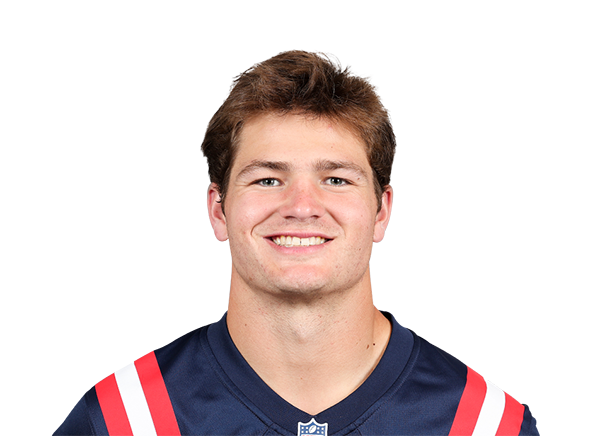
Drake Maye
QB ·NE at MIA · QB1
StartMIA is allowing the completions that keep drives alive.
| Matchup metric | Value |
|---|---|
| Opponent QB PPR / G | 17.5 · #25/32 |
| Profile EPA / DB | +0.175 |
| MIA pass success allowed | 53.68% |
| MIA sack rate | 3.16% |
Maye's matchup profile shows +0.175 EPA per dropback, CPOE of +3.5 points and a 9.0 Yd intended target depth. MIA has allowed +0.312 EPA per dropback and a 53.68% passing success rate. Those are the more useful signals than its low raw WR fantasy allowance: the defense is allowing efficient offense, even if the fantasy points have landed unevenly across positions.
In the team field map, MIA has allowed 29 completions on 33 short-left attempts and 31 on 38 short-right attempts. Both areas have produced about +0.50 EPA per attempt for opponents. Maye can keep this offense on schedule without needing a parade of highlight throws. NE's 7.5-point favoritism limits the case for enormous volume, but it supports scoring opportunities. He belongs ahead of Goff in a close one-QB decision.
Lineup call: Start over Goff or Brissett.

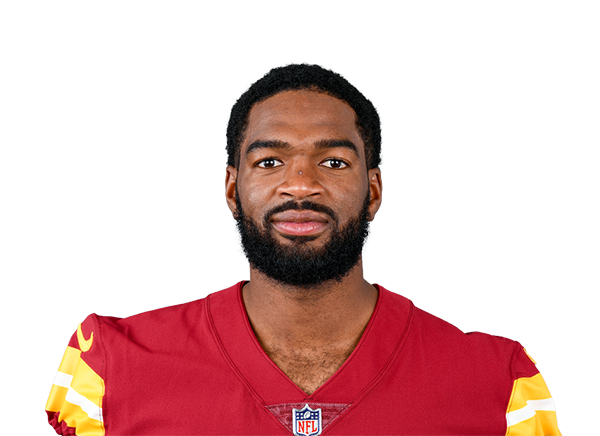
Jacoby Brissett
QB ·ARI at DAL · QB stream
StreamDAL is a real upgrade, even for an inefficient passing game.
| Matchup metric | Value |
|---|---|
| Opponent QB PPR / G | 17.9 · #27/32 |
| DAL pass EPA allowed | +0.271 |
| DAL pass success allowed | 51.84% |
| Game total | 54.5 |
Brissett's matchup profile is not disguising a breakout: -0.033 EPA per dropback, a 6.8 Yd intended target depth and a 41.2% completion rate under pressure. The attraction is DAL's defense. It has allowed +0.271 EPA per dropback, a 51.84% passing success rate and generated sacks on only 4.08% of dropbacks. That gives ARI a much more workable drive environment.
DAL's mapped short-left and short-right areas have allowed 7.29 and 7.44 Yds per attempt on 35 and 46 throws. Brissett's offense already uses those areas heavily, so this does not require a new passing identity. ARI is a 6.5-point underdog in a 54.5 total. That makes him a sensible bye-week or superflex option, while Prescott and Maye remain the cleaner one-QB choices.
Lineup call: Stream in deeper one-QB leagues; start in superflex.

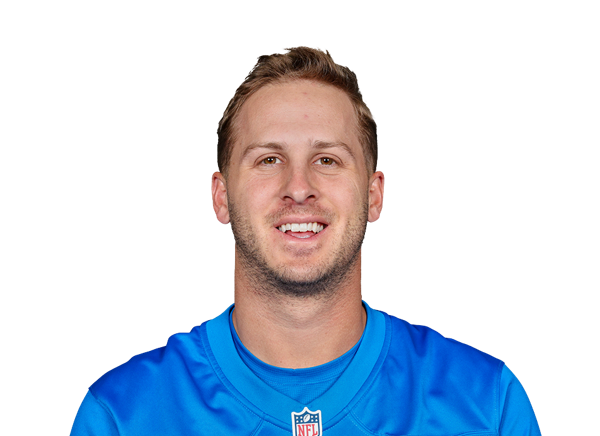
Jared Goff
QB ·DET vs MIN · QB2
Sit in close callsGood quarterback. Very inconvenient defense.
| Matchup metric | Value |
|---|---|
| Opponent QB PPR / G | 7.3 · #1/32 |
| MIN pressure rate | 47.6% |
| MIN sack rate | 10.14% |
| MIN pass TD allowed | 3 in 6 G |
Goff's +0.310 profile EPA per dropback is excellent. This call is about the replacement decision, not a claim that he has played badly. MIN has allowed only three passing TDs in six games, -0.216 EPA per dropback and a 36.23% passing success rate. It also brings a 47.6% pressure rate and a 10.14% sack rate. That is a rough way to earn every fantasy point through the air.
The field map shows MIN holding short-left throws to 4.53 Yds per attempt and short-right throws to 3.81, across 34 and 37 attempts. Those areas are not giving the offense a free underneath release. Goff's 50.8% pressure completion rate is respectable, but it does not create a rushing floor. Prescott or Maye offers the better matchup when both are available; Goff remains a superflex starter.
Lineup call: Prefer Prescott or Maye; keep Goff in superflex.
Running backs
Warren’s lanes against CLE
Observed Yds per carry by lane. Samples and scheme context are discussed below.
| Matchup | Warren | CLE |
|---|---|---|
| Left end | 7.5 | 7.076923076923077 |
| Left tackle | 2.111111111111111 | 5.388888888888889 |
| Middle | 6.1923076923076925 | 3.511627906976744 |
IND’s left side gives Tuten an opening
IND Yds allowed / carries by lane: 118/18, 151/23, 121/19. Tuten has 17, 9 and 9 attempts in these lanes.
| Matchup | IND |
|---|---|
| Left end | 6.555555555555555 |
| Left tackle | 6.565217391304348 |
| Left guard | 6.368421052631579 |

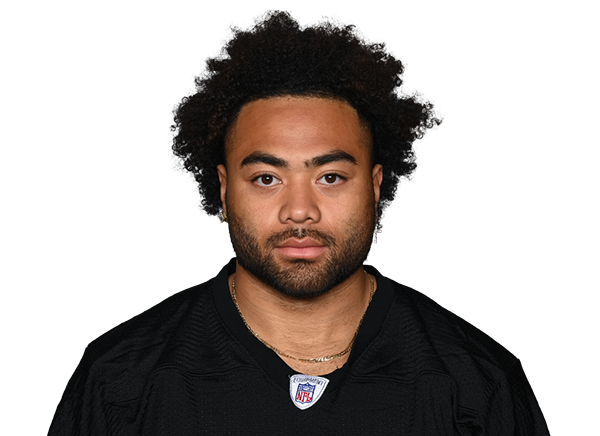
Jaylen Warren
RB ·PIT vs CLE · RB2
StartWarren can win outside the teeth of this defense.
| Matchup metric | Value |
|---|---|
| Opponent RB PPR / G | 19.7 · #8/32 |
| RYOE / attempt | +1.48 Yds |
| Targets / G | 4.9 |
| CLE left end allowed | 184 Yds / 26 att |
Warren has 102 carries for 561 Yds, plus 34 targets through seven games. His profile adds 1.48 rushing Yds over expected per attempt and 3.68 Yds after contact per attempt. The recent workload is useful too: 15, 14 and 18 carries in his last three games, with at least four targets in every game this season. That is an RB2 role rather than a touchdown audition.
CLE's overall run defense is competent, but the lanes are uneven. It has allowed 184 Yds on 26 left-end runs and 97 on 18 left-tackle runs. Warren has 120 Yds on 16 left-end attempts himself. CLE also allows a 15.73% explosive run rate. PIT is favored by 3.5 in a low 38.5 total, so the case is steady touches with an outside rushing path, not a shootout.
Lineup call: Start over Swift, Stevenson or a low-volume receiving specialist.
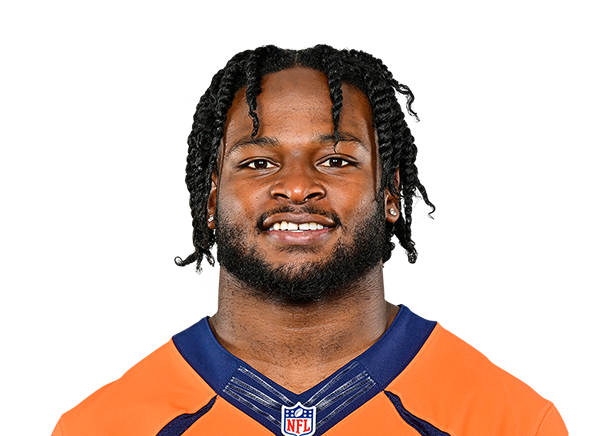
Javonte Williams
RB ·DAL vs ARI · RB2
StartThe red zone role is doing the heavy lifting.
| Matchup metric | Value |
|---|---|
| Opponent RB PPR / G | 22.6 · #20/32 |
| RZ carries | 31 |
| DAL RZ rush share | 70.5% |
| Rush EPA / att | +0.104 |
Williams owns 31 red zone carries and a 70.5% share of DAL's red zone rushing attempts in the matchup research feed. His profile shows +0.104 rushing EPA per attempt. Last week's 25 carries against PHI were his season high, but the more repeatable point is his control of the valuable rushing work.
ARI allows only -0.064 EPA per rush, so this is not a soft run defense disguised by a bad passing defense. The middle is the useful scoring lane: ARI has conceded five TDs on 74 middle runs, while Williams has scored four times on 37 middle attempts. A 54.5 total with DAL favored by 6.5 gives that role a favorable setting. Start him for the scoring share and carry access, rather than expecting every run to look like an open freeway.
Lineup call: Start over Swift or Stevenson.

Bhayshul Tuten
RB ·JAX vs IND · RB2 / flex
StartThe left side is where this matchup gets interesting.
| Matchup metric | Value |
|---|---|
| Opponent RB PPR / G | 22.0 · #17/32 |
| Yds after contact / att | 3.62 |
| IND left lanes allowed | 390 Yds / 60 att |
| JAX spread | -10 |
Tuten has 94 carries across six games, with 3.62 Yds after contact per attempt and 0.23 forced missed tackles per touch in his profile. His 57.1% share of JAX's red zone carries provides a scoring route to go with the volume. JAX is favored by 10 against IND, a useful setup for a runner averaging 15.7 attempts.
IND's left-side results are striking: 118 Yds on 18 left-end attempts, 151 on 23 left-tackle attempts and 121 on 19 left-guard attempts. Combined, that is 390 Yds on 60 runs, or 6.5 per carry. Tuten has directed 35 of his 94 carries to those three lanes. IND's overall +0.044 EPA allowed per rush backs up the lane read. This is a stronger RB2 case than chasing a shared backfield solely because its opponent allows catches.
Lineup call: Start over Swift or Stevenson.

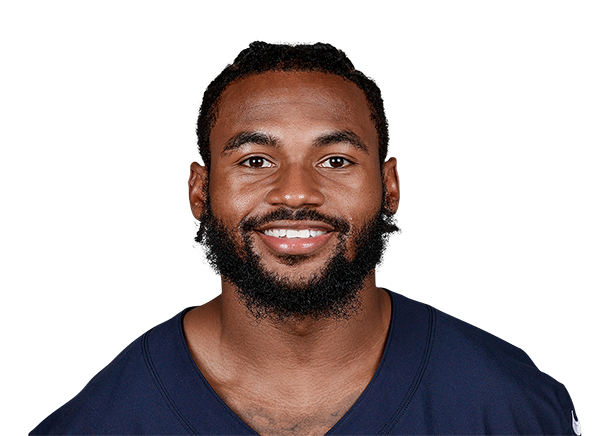
D'Andre Swift
RB ·CHI at SEA · Flex
Sit for a stronger RB2Twenty-two carries last week do not travel automatically.
| Matchup metric | Value |
|---|---|
| Opponent RB PPR / G | 20.9 · #14/32 |
| SEA rush success allowed | 33.71% |
| Swift RYOE / att | -0.49 Yds |
| Last 3 target counts | 5, 5, 4 |
Swift's 22 carries against NE arrived with Monangai unavailable. Monangai is now listed questionable in the early Week 8 depth feed, so last week's setup cannot simply be penciled in again. Swift still offers useful PPR involvement, with four or five targets in each of his last three games. That keeps him in the flex conversation.
SEA allows -0.124 EPA per rush and a 33.71% rushing success rate. Swift has generated most of his efficient rushing on the right edge and at tackle, but SEA has allowed only 55 Yds on 17 right-tackle runs and 59 on 16 left-tackle runs. His own -0.49 RYOE per attempt gives little reason to expect him to manufacture a big efficiency upgrade. I would use Warren, Javonte or Tuten first. Swift stays usable when the alternative has no stable role.
Lineup call: Prefer Warren, Javonte or Tuten; retain as a PPR flex.
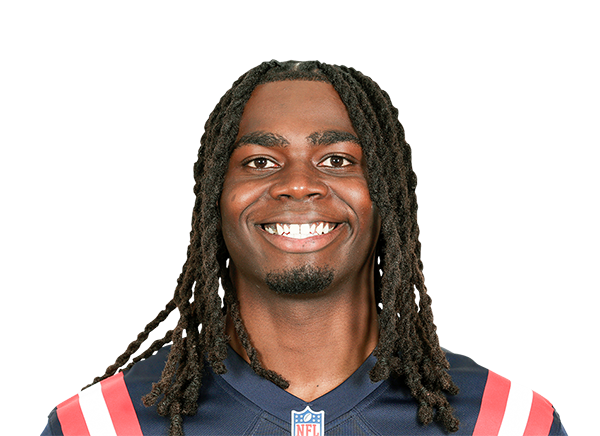
Rhamondre Stevenson
RB ·NE at MIA · PPR flex
Sit as an RB2MIA's allowance is better than Stevenson's workload.
| Matchup metric | Value |
|---|---|
| Opponent RB PPR / G | 28.5 · #30/32 |
| Season carries | 77 |
| Team rush share | 37.7% |
| MIA middle allowed | 3.41 Yds / att |
MIA has allowed 28.5 RB PPR points per game, but that is the whole opposing backfield. Stevenson carried six times against CHI after 13 and 14 in the preceding games. Across the season he has 77 carries, a 37.7% share of team rushing attempts and nine red zone carries. The soft matchup does not hand him Henderson's touches.
There is a receiving route to a useful PPR score: Stevenson has 20 catches for 204 Yds on 24 targets, and MIA has allowed five receiving TDs to RBs. His rushing lane profile is less exciting. Thirty-two of his 77 attempts are through the middle, where MIA allows 191 Yds on 56 runs, just 3.41 per attempt. NE's 7.5-point favoritism helps the backfield as a whole. Stevenson is a flex, not the player I would promote over Warren or Tuten.
Lineup call: Use as a PPR flex; prefer Warren, Javonte or Tuten at RB2.
Wide receivers
Target volume behind the flex decisions
Season targets divided by games played. Availability and defensive fit remain separate parts of the call.
| Matchup | Targets |
|---|---|
| Golden | 9.9 |
| Watson | 8 |
| Wilson | 9.4 |
| Washington | 7.7 |
| Tucker | 6.7 |
| Waddle | 6.4 |

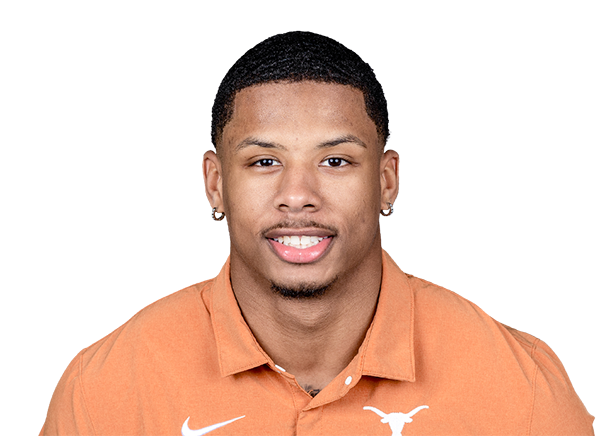
Matthew Golden
WR ·GB vs CAR · WR2
Start if availableThe target volume is strong. The medical decision comes first.
| Matchup metric | Value |
|---|---|
| Opponent WR PPR / G | 27.9 · #7/32 |
| Targets / G | 9.9 |
| Target share | 26.2% |
| CAR Cover 3 allowed | 5.17 Yds / tgt |
Golden was a nonparticipant in Tuesday's walkthrough with shoulder and foot issues. This WR2 call requires him active with his normal receiving role on Thursday. His profile shows 9.9 targets per game, 26.2% target share and 40.0% air Yds share. His last two games brought 13 and 12 targets. That opportunity is the reason to keep a place ready for him.
CAR is a difficult efficiency matchup. It allows 27.9 WR PPR points per game and ranks second toughest in Route IQ's explosive prevention grade. Its Cover 3 has allowed 507 Yds on 98 targets, or 5.17 Yds per target; that shell accounts for 48.04% of its classified shell targets. Golden has 155 Yds on 16 Cover 3 targets himself. The matchup tempers the ceiling, but normal double-digit target demand is still worth starting over Tucker or a compromised Waddle.
Lineup call: WR2 if active with a normal role; otherwise replace before TNF.
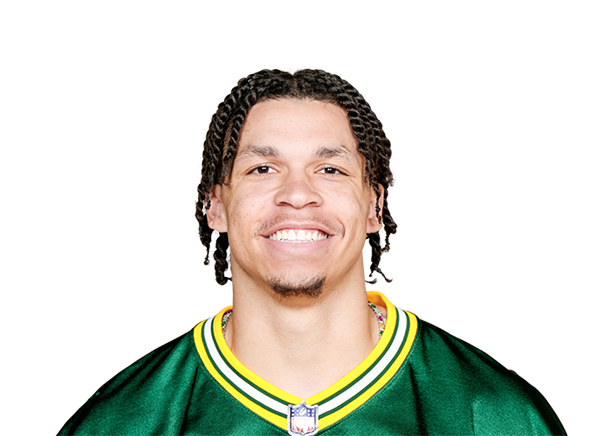
Christian Watson
WR ·GB vs CAR · WR3 / flex
Start as a flexZone production keeps Watson involved in a tougher draw.
| Matchup metric | Value |
|---|---|
| Opponent WR PPR / G | 27.9 · #7/32 |
| Last 3 target counts | 8, 8, 8 |
| Zone YPRR | 3.19 |
| CAR explosive prevention rank | 2 / 32 |
Watson has eight targets in each of his last three games and 595 receiving Yds through seven. The coverage split is emphatic: 511 Yds on 160 classified zone routes, compared with 28 on 43 man routes. That is 3.19 versus 0.65 Yds per route. CAR's zone-heavy structure gives him the right broad family of coverage.
The specific shell prevents an automatic upgrade. CAR's Cover 3 has allowed only 5.17 Yds per target across 98 targets, while Watson has produced 244 Yds on 20 targets against that shell. Both facts matter. His 19.6% explosive target rate is impressive, but CAR's strong prevention grades make this a volume-backed flex call. If Golden misses Thursday, the target competition changes in Watson's favor; no extra target count is being assumed here.
Lineup call: Start as a flex ahead of Tucker or Waddle.
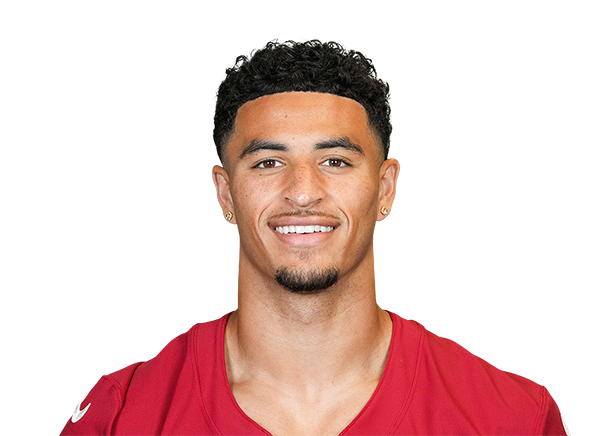
Michael Wilson
WR ·ARI at DAL · PPR flex
StartDAL gives Wilson a better chance to turn volume into catches.
| Matchup metric | Value |
|---|---|
| Opponent WR PPR / G | 35.7 · #24/32 |
| Targets / G | 9.4 |
| Profile route participation | 93.7% |
Wilson has at least seven targets in every game, a 24.3% target share and 93.7% route participation in his matchup profile. Efficiency has been the problem: 5.7 Yds per target and -0.098 receiving EPA per target. This is a PPR volume bet on a friendlier opponent, not a claim that Wilson has suddenly become a big-play specialist.
DAL allows 35.7 WR PPR points per game and +0.271 EPA per dropback. Its 67.21% zone usage also gives Wilson more exposure to the family in which he has 237 Yds on 33 targets, versus 107 on 21 man targets. DAL's Cover 3 has allowed 7.59 Yds per target on 74 targets. ARI's 6.5-point underdog position in a 54.5 total supports continued throwing. Wilson's steady demand earns the flex spot over a receiver who needs two deep catches to get there.
Lineup call: Start in PPR flex over Tucker or Waddle.
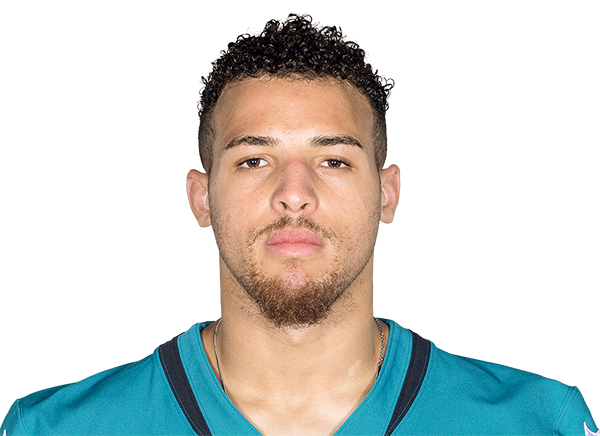
Parker Washington
WR ·JAX vs IND · WR3 / flex
StartThe overall rank hides a more workable shell matchup.
| Matchup metric | Value |
|---|---|
| Opponent WR PPR / G | 29.0 · #8/32 |
| Target share | 25.8% |
| Air Yds share | 41.2% |
| IND Cover 1 allowed | 7.86 Yds / tgt |
Washington carries 25.8% of JAX's targets and 41.2% of its air Yds. His last two appearances brought nine and 11 targets. IND's 29.0 WR PPR points allowed per game ranks eighth fewest, so the headline fantasy allowance does not scream start. The role is the first part of the case.
The coverage detail is the second. IND's Cover 3 allows 7.78 Yds per target on 65 targets, and its Cover 1 allows 7.86 on 42. Washington has 184 Yds on 18 Cover 3 targets and 113 on 13 Cover 1 targets. He has produced 2.76 Yds per classified man route and 2.52 against zone, giving him a route across both families. JAX is favored by 10, which makes enormous pass volume less attractive, but his share of the work still supports a flex start.
Lineup call: Start as a flex over Tucker or Waddle.

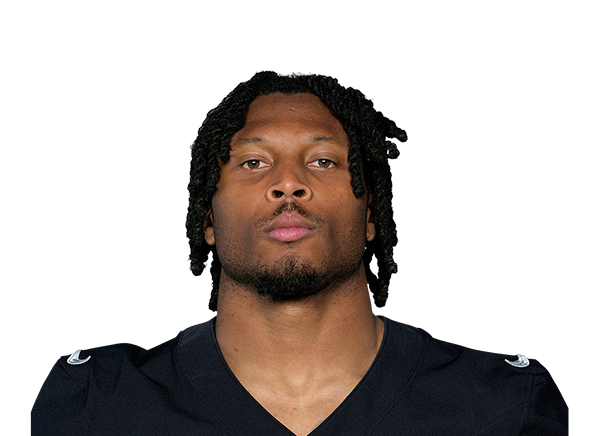
Tre Tucker
WR ·LV at NYJ · Upside flex
Sit in WR2 decisionsThe target spike meets a defense with fewer easy deep lanes.
| Matchup metric | Value |
|---|---|
| Opponent WR PPR / G | 31.2 · #15/32 |
| Last game targets | 12 |
| NYJ Cover 1 allowed | 4.00 Yds / tgt |
| Man / zone YPRR | 1.70 / 2.67 |
Tucker's 12 targets against LAR were a season high, and his last three games have brought five, seven and 12. His 10.1 Yds per target and 17.0% explosive target rate keep him interesting as an upside flex. The issue is whether that one-game target spike deserves an automatic WR2 promotion.
NYJ's Cover 1 has allowed only 180 Yds on 45 targets, or 4.0 per target. Its Cover 3 has allowed 325 on 54, or 6.02. Those shells account for 20.74% and 24.88% of classified shell targets. Tucker's production against man is 104 Yds on 61 routes, compared with 344 on 129 zone routes. There are usable zone paths, but the opponent is not offering the same generosity BUF did two weeks earlier. Wilson and Washington offer stronger share-based PPR cases.
Lineup call: Prefer Wilson or Washington at WR2/flex; keep Tucker for upside.

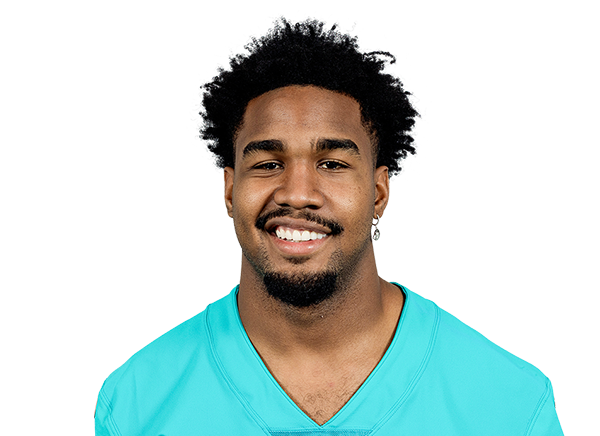
Jaylen Waddle
WR ·DEN vs KC · Bench / deep flex
SitThe chest issue lands on top of a thin efficiency case.
| Matchup metric | Value |
|---|---|
| Opponent WR PPR / G | 23.9 · #3/32 |
| Yds / target | 6.1 |
| KC WR TD allowed | 1 in 6 G |
| Game total | 40.5 |
Waddle exited the ARI game with a chest injury and is listed questionable in the current depth feed. Even before a final status decision, the receiving profile is a difficult sell for a normal WR2 slot: 6.4 targets per game, 6.1 Yds per target and just +0.046 receiving EPA per target.
KC has allowed only one WR receiving TD in six games and 23.9 WR PPR points per game. The shell results are not uniformly tough: its Cover 3 has allowed 8.54 Yds per target on 59 targets. Waddle, though, has only 65 Yds on 14 targets against Cover 3 himself. KC's Cover 1 is much tighter at 4.55 per target across 33 targets. In a 40.5 total, the combination of uncertain health and modest efficiency is enough to use a cleaner option.
Lineup call: Bench for Golden if cleared, Watson, Wilson or Washington.
Tight ends
Four different TE assignments
PPR scoring subset per game: excludes fumbles, two point conversions and bonuses. Positional totals cover all opposing TEs.
| Matchup | Allowed |
|---|---|
| DET | 29.366666666666664 |
| MIA | 20.8 |
| ARI | 16.842857142857145 |
| MIN | 6.883333333333333 |

T.J. Hockenson
TE ·MIN at DET · TE1
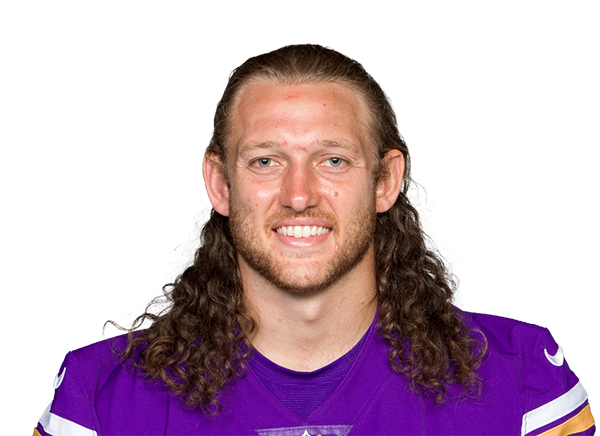
StartDET has made TE scoring a weekly group project.
| Matchup metric | Value |
|---|---|
| Opponent TE PPR / G | 29.4 · #32/32 |
| Target share | 20.9% |
| RZ target share | 33.3% |
| DET TE TD allowed | 10 in 6 G |
DET has conceded 56 catches, 602 Yds and 10 receiving TDs to TEs in six games, producing 29.4 PPR points per game. Hockenson brings a 20.9% target share, a 33.3% red zone target share and targets on 25.8% of his routes in the matchup profile. That is enough actual receiving involvement to use the matchup.
Route participation is only 60.3% in that profile, so this is not a full-time route claim. He has five targets in his latest appearance, and the classified man sample produced six catches on six targets for 86 Yds. DET uses man on 35.78% of classified coverage, while its downfield prevention grade sits 28th. The defense is stronger after the catch, which makes his target and red zone access more relevant than an imagined YAC explosion.
Lineup call: Start over Henry, Ferguson or a low-volume streamer.
Hunter Henry
TE ·NE at MIA · TE stream / low TE1
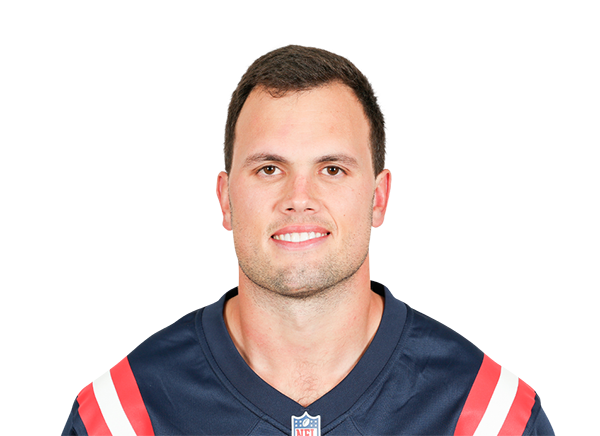
StartThe recent targets and MIA's target areas point the same way.
| Matchup metric | Value |
|---|---|
| Opponent TE PPR / G | 20.8 · #30/32 |
| Latest targets | 7 |
| Rec EPA / target | +0.564 |
| MIA target area rank | 32 / 32 |
Henry has seven targets in his latest game after five in the previous one. His season profile shows 4.4 per game, 83.9% catches and +0.564 receiving EPA per target. The routes are not elite volume at 68.1% participation, but the recent involvement is strong enough to use in a TE stream.
MIA has allowed 44 catches for 448 Yds and six receiving TDs to TEs in six games, or 20.8 PPR points per game. Route IQ grades the target areas Henry uses as the softest of 32 defenses, at a weighted 8.55 Yds per target allowed. MIA's zone usage is 73.48%; Henry has caught 15 of 17 classified zone targets for 164 Yds. This is a more convincing start than relying on Ferguson simply because DAL has a large implied team total.
Lineup call: Start over Ferguson; use ahead of LaPorta in a close matchup call.

Jake Ferguson
TE ·DAL vs ARI · TE2
SitA good team total cannot catch the ball for him.
| Matchup metric | Value |
|---|---|
| Opponent TE PPR / G | 16.8 · #27/32 |
| Target share | 9.4% |
| Last 2 target counts | 3, 1 |
| Rec EPA / target | -0.271 |
Ferguson has one target in his latest game, three in the previous one and a 9.4% season target share. His profile shows routes on 64.9% of his own passing-play snaps, 4.6 Yds per target and -0.271 receiving EPA per target. That is not enough opportunity or efficiency to let the matchup do all the work.
ARI has allowed 16.8 TE PPR points per game, but its shell mix is less forgiving than that average suggests. Cover 4 accounts for 27.32% of classified shell targets and allows 6.02 Yds per target; Cover 6 accounts for 21.46% and allows 5.80. Ferguson has 79 Yds on 132 classified zone routes. DAL's 54.5 game total is attractive for the offense, but Henry or Hockenson offers a much clearer receiving path.
Lineup call: Prefer Hockenson or Henry; do not stream from the total alone.
Sam LaPorta
TE ·DET vs MIN · Low TE1 / TE2
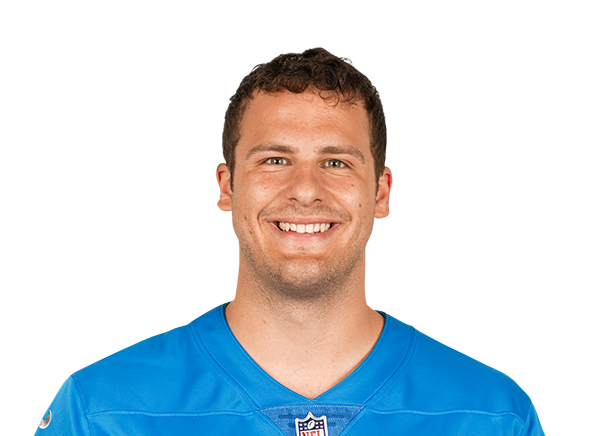
Sit in close callsRespect the season. Respect MIN's defense too.
| Matchup metric | Value |
|---|---|
| Opponent TE PPR / G | 6.9 · #1/32 |
| MIN TE receiving TD allowed | 0 |
| MIN zone use | 90.85% |
LaPorta has averaged 6.5 targets and generated +0.847 receiving EPA per target in his matchup profile. Those are good reasons to keep this a close-call sit rather than a blanket bench order. His latest game brought only two targets, and MIN has allowed 18 TE catches, 233 Yds and no receiving TDs in six games.
MIN plays zone on 90.85% of classified coverage. LaPorta has 203 Yds on 138 classified zone routes, or 1.47 per route, compared with 71 on just 22 man routes. The likely family is the less productive of his two samples. MIN also allows -0.216 EPA per dropback and generates pressure on 47.6% of dropbacks. If Henry or Hockenson is on the same roster, I would make the matchup switch; a two-target backup elsewhere is not an upgrade.
Lineup call: Prefer Hockenson or Henry; retain over low-volume emergency TEs.
Fantasy points allowed: one sortable board
Select any column header to sort. Rank 1 is fewest allowed; rank 32 is most. Swipe inside the table on phones. PPR scoring subset excludes fumbles, two point conversions and bonuses.
Week 8 fantasy points allowed
PPR scoring subset per game; excludes fumbles, two point conversions and bonuses. Rank 1 fewest allowed, 32 most. Sort on unrounded values.
| DET | MIN | 6 | 23.3 | 19.7 | 38.6 | 29.4 | 111.0 |
| BUF | BAL | 6 | 21.1 | 28.0 | 42.3 | 15.3 | 106.7 |
| WAS | PHI | 6 | 20.9 | 20.4 | 35.9 | 21.5 | 98.6 |
| LV | @NYJ | 7 | 18.4 | 26.1 | 31.7 | 19.9 | 96.1 |
| ATL | @TB | 7 | 17.5 | 26.6 | 34.4 | 16.4 | 94.9 |
| NO | BYE | 7 | 15.2 | 30.8 | 30.2 | 16.7 | 92.9 |
| ARI | @DAL | 7 | 19.5 | 22.6 | 32.4 | 16.8 | 91.4 |
| MIA | NE | 6 | 17.5 | 28.5 | 23.8 | 20.8 | 90.7 |
| DAL | ARI | 7 | 17.9 | 24.6 | 35.7 | 12.4 | 90.7 |
| PHI | @WAS | 7 | 17.2 | 21.2 | 40.1 | 10.5 | 88.9 |
| HOU | BYE | 7 | 17.3 | 22.7 | 37.1 | 10.1 | 87.2 |
| TEN | @CIN | 7 | 14.1 | 22.3 | 35.8 | 11.1 | 83.2 |
| JAX | IND | 6 | 15.0 | 17.5 | 38.3 | 11.8 | 82.6 |
| GB | CAR | 7 | 11.7 | 25.8 | 35.4 | 9.0 | 82.0 |
| CAR | @GB | 6 | 12.1 | 28.6 | 27.9 | 13.3 | 81.9 |
| BAL | @BUF | 7 | 14.8 | 18.5 | 35.8 | 12.3 | 81.4 |
| IND | @JAX | 7 | 16.3 | 22.0 | 29.0 | 13.7 | 81.0 |
| NE | @MIA | 7 | 14.7 | 20.6 | 32.4 | 12.7 | 80.4 |
| LAC | @LA | 6 | 14.3 | 23.9 | 30.4 | 11.4 | 80.0 |
| DEN | KC | 7 | 12.6 | 23.5 | 27.4 | 16.1 | 79.6 |
| CLE | @PIT | 7 | 13.8 | 19.7 | 32.1 | 13.9 | 79.5 |
| SF | BYE | 7 | 14.8 | 23.1 | 29.2 | 12.1 | 79.2 |
| NYG | BYE | 7 | 15.1 | 20.5 | 31.3 | 12.0 | 78.9 |
| CIN | TEN | 6 | 13.9 | 18.2 | 31.2 | 15.3 | 78.6 |
| NYJ | LV | 7 | 14.2 | 22.2 | 31.2 | 10.4 | 78.0 |
| TB | ATL | 7 | 13.2 | 18.2 | 29.6 | 16.2 | 77.2 |
| CHI | @SEA | 7 | 15.7 | 18.9 | 29.5 | 13.1 | 77.2 |
| PIT | CLE | 7 | 11.2 | 20.5 | 30.5 | 10.9 | 73.2 |
| KC | @DEN | 6 | 10.9 | 19.6 | 23.9 | 18.5 | 72.9 |
| LAR | LAC | 7 | 14.1 | 20.9 | 26.3 | 9.9 | 71.2 |
| SEA | CHI | 7 | 8.8 | 20.9 | 21.5 | 9.9 | 61.1 |
| MIN | @DET | 6 | 7.3 | 16.4 | 25.3 | 6.9 | 55.8 |
Explore Route IQ, Rush IQ, QB Hub and Data Lab for the underlying comparisons.
The final lineup board
Final lineup board
Swipe to compare every column.
| Dak Prescott | Start | DAL vs ARI |
| Drake Maye | Start | NE at MIA |
| Jacoby Brissett | Stream | ARI at DAL |
| Jared Goff | Sit in close calls | DET vs MIN |
| Jaylen Warren | Start | PIT vs CLE |
| Javonte Williams | Start | DAL vs ARI |
| Bhayshul Tuten | Start | JAX vs IND |
| D'Andre Swift | Sit for a stronger RB2 | CHI at SEA |
| Rhamondre Stevenson | Sit as an RB2 | NE at MIA |
| Matthew Golden | Start if available | GB vs CAR |
| Christian Watson | Start as a flex | GB vs CAR |
| Michael Wilson | Start | ARI at DAL |
| Parker Washington | Start | JAX vs IND |
| Tre Tucker | Sit in WR2 decisions | LV at NYJ |
| Jaylen Waddle | Sit | DEN vs KC |
| T.J. Hockenson | Start | MIN at DET |
| Hunter Henry | Start | NE at MIA |
| Jake Ferguson | Sit | DAL vs ARI |
| Sam LaPorta | Sit in close calls | DET vs MIN |
Published for research and entertainment purposes. Not betting advice.
Discussion
Sign in to join the discussion.
Loading comments…