Dallas WR Data: Stable Targets, Falling Conversion for CeeDee Lamb
An analysis of Dallas’ three leading wide receivers separates changes in opportunity from changes in efficiency across the first seven games.
Get the tools behind this post. Free Statyx account, no card needed.
Sign up free Statyx Staff
CeeDee Lamb averaged 11.50 targets per game in Weeks 1–4 and 11.67 in Weeks 5–7. His receiving yards per target fell from 10.83 to 4.37. Over the same windows, George Pickens improved from 8.04 to 8.67, while Ryan Flournoy rose from 4.52 to 11.76.
The main change in Dallas’ receiving production was therefore not a simple transfer of Lamb’s target volume. His conversion of those targets deteriorated, Pickens earned more work, and Flournoy produced more from a smaller target sample. This analysis separates those changes using opportunity, efficiency and targeted-play value.
This comparison uses Statyx Data Lab’s custom week ranges and metric views to examine opportunity alongside receiving efficiency. A walkthrough and the exact filtered links are included below.
The comparison
We compare the same three receivers across two non-overlapping windows: Weeks 1–4, four games each, and Weeks 5–7, three games each. They were Dallas’ three most-targeted wide receivers in both windows. Per-game rates account for the unequal number of games; per-target rates use pooled totals rather than averaging individual game rates. This is a within-team comparison, not a league ranking.
| Player / period | Targets | Rec | Yards | Yds/tgt | EPA/tgt | Success |
|---|---|---|---|---|---|---|
| Lamb · W1–4 | 46 | 37 | 498 | 10.83 | +0.9053 | 69.57% |
| Lamb · W5–7 | 35 | 16 | 153 | 4.37 | −0.3851 | 31.43% |
| Pickens · W1–4 | 28 | 18 | 225 | 8.04 | +0.3630 | 50.00% |
| Pickens · W5–7 | 30 | 19 | 260 | 8.67 | +0.4703 | 63.33% |
| Flournoy · W1–4 | 23 | 13 | 104 | 4.52 | +0.1562 | 34.78% |
| Flournoy · W5–7 | 17 | 14 | 200 | 11.76 | +0.5072 | 64.71% |
Targets are passes directed at the receiver. Success is the proportion of targets with positive expected points added. All three recent samples are fewer than 40 targets.
1. Opportunity changed differently for each receiver
Lamb’s target frequency was nearly unchanged, but his team target share declined from 31.94% to 28.93%. Dallas had 144 team targets in the first window and 121 in the second, equivalent to 36.00 and 40.33 per game. Stable individual volume can therefore coexist with a smaller share of the offense.
Pickens’ targets increased from 7.00 to 10.00 per game, and his team target share grew from 19.44% to 24.79%. His recent production combines increased opportunity with improved per-target efficiency.
Flournoy presents the opposite workload pattern: targets per game fell slightly, from 5.75 to 5.67, and target share moved from 15.97% to 14.05%. His receiving yards per game nevertheless increased from 26.00 to 66.67. That improvement came from production per target rather than a larger workload.
Receiving efficiency changed more than target volume
Yards per target · Weeks 1–4 vs. Weeks 5–7
| Player | Weeks 1-4 | Weeks 5-7 |
|---|---|---|
| CeeDee Lamb | 10.83 | 4.37 |
| George Pickens | 8.04 | 8.67 |
| Ryan Flournoy | 4.52 | 11.76 |
Target denominators, early → recent: Lamb 46 → 35; Pickens 28 → 30; Flournoy 23 → 17. Four early games and three recent games per player.
2. Lamb’s decline appears in conversion metrics
Lamb’s catch rate fell from 80.43% to 45.71%. His first-down rate per target declined from 60.87% to 25.71%, and his yards after the catch per reception decreased from 4.22 to 1.81. These measures locate the production decline in both completion outcomes and the additional yardage generated after completed passes.
A lower-value target mix alone is not established by the available opportunity data. Lamb’s average target depth increased from 10.22 to 11.00 yards. He had 385 recent air yards against Pickens’ 303, along with seven red-zone targets and six end-zone targets. The equivalent Pickens figures were four and three. Red-zone and end-zone categories overlap and should not be summed.
Those observations do not identify the cause. Completion outcomes can reflect accuracy, coverage, route difficulty and receiver execution. Air yards measure intended depth, not whether a pass was catchable. The data supports an efficiency decline despite continued opportunity; it does not isolate responsibility for it.

3. EPA confirms the outcome gap, with an important outlier
Receiving EPA measures the change in expected points on passing plays directed at a player. Lamb’s EPA per target shifted from +0.9053 to −0.3851. Pickens improved from +0.3630 to +0.4703, and Flournoy from +0.1562 to +0.5072. Success rate describes how frequently those targets produced positive EPA, rather than the average size of the outcome.
Target outcomes: EPA and the recent split
Expected points added per target
| Player | Weeks 1-4 | Weeks 5-7 |
|---|---|---|
| CeeDee Lamb | 0.9053 | -0.3851 |
| George Pickens | 0.363 | 0.4703 |
| Ryan Flournoy | 0.1562 | 0.5072 |
These are related measures of the same plays, not independent tests of receiver ability. Neither EPA nor receiving success rate isolates the receiver from the quarterback, protection or defense.
Lamb’s Week 6 game against Green Bay contributes −14.2814 receiving EPA. His full Weeks 5–7 total was −13.4796. Excluding Green Bay leaves approximately +0.0472 EPA per target on 17 targets. The negative three-game average is therefore heavily concentrated in one game, rather than uniform across the period.
4. The per-target gap survives two useful checks
Pickens gained more yards per target in each recent game: 10.00 versus Lamb’s 1.80 against Tampa Bay; 6.64 versus 3.89 against Green Bay; and 9.50 versus 6.17 against Philadelphia. That consistency is useful, although each individual game contains only 5–18 targets for the two players.
The per-target gap persisted in each recent game
Receiving yards per target · Sample sizes below
| Game | CeeDee Lamb | George Pickens |
|---|---|---|
| W5 / TB | 1.8 | 10 |
| W6 / GB | 3.89 | 6.64 |
| W7 / PHI | 6.17 | 9.5 |
Targets, Lamb / Pickens: Week 5, 5 / 13; Week 6, 18 / 11; Week 7, 12 / 6.
Availability complicates Week 5. The Cowboys’ separately sourced reporting says Lamb left the Tampa Bay game with a quad injury. Excluding that game, he recorded 144 yards on 30 targets in Weeks 6–7, or 4.80 per target; Pickens had 130 on 17, or 7.65. The per-target difference remains, while Lamb leads that shorter comparison in total yardage.
The latest game also challenges a blanket decline narrative. Against Philadelphia, Lamb had 74 yards, two touchdowns and +0.3033 EPA per target. The period average should not replace that more recent observation.
What the finding establishes
Dallas’ receiving distribution changed in three distinct ways: Pickens’ opportunity increased; Flournoy’s efficiency rose without an increase in targets per game; and Lamb’s conversion rates declined despite stable target frequency. Combining those patterns into a single claim that targets simply moved from one receiver to another would miss the underlying change.
The evidence supports a recent divergence in opportunity and results. It does not establish a permanent change in receiver quality, an optimal redistribution of targets, or a forecast that the observed efficiency rates will persist. Flournoy’s 17-target recent sample is particularly small. Additional games are needed to distinguish a sustained change from short-run variation.
Recreate this comparison in Statyx Data Lab
Data Lab’s custom week ranges let you check whether a production change came with a different workload or a different return on that workload. These two views reproduce the periods used here: Dallas WRs, Weeks 1–4 and Dallas WRs, Weeks 5–7.
- Set Season: 2026, Position: WR, View: Custom range and Team: DAL. Use Min targets: 1 to retain the full Dallas comparison rather than filtering out the smaller samples.
- Run Weeks 1–4, then Weeks 5–7. Keep the team, position and target threshold unchanged.
- Use Overview for targets and production, Opportunity for target share, and Efficiency for Yds/Target, EPA/Target and Success %. Compare the same players across both windows.
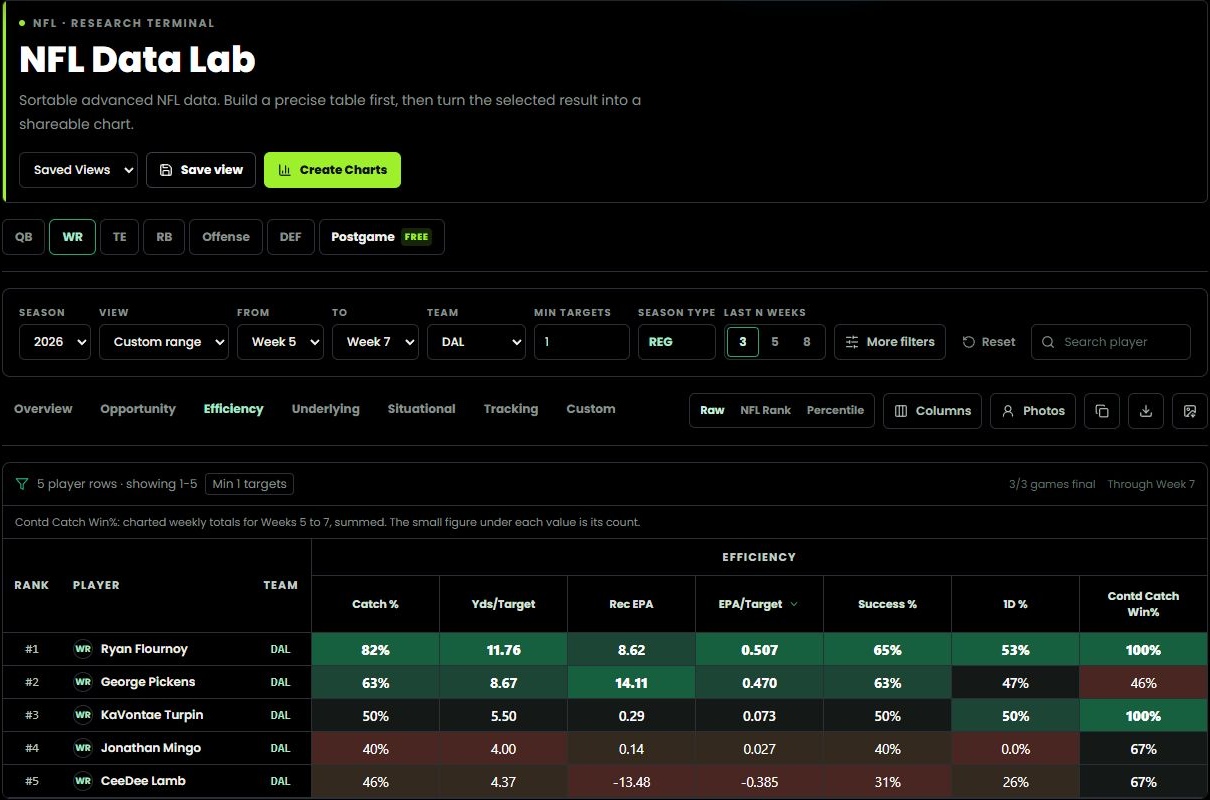
A larger yardage total can reflect more targets, better results per target, or both. Checking the metric groups together separates those possibilities. Keep the game and target counts alongside the rates, especially for Flournoy’s smaller recent sample.
Open this Dallas WR comparison in Data Lab →
Data and definitions
Source: Statyx NFL MCP. Period comparison rechecked October 29, 2026, at 4:42 p.m. ET. Weekly detail comes from the original October 29 research pull, 3:07–3:18 p.m. ET. Latest included game: Dallas at Philadelphia, October 26. No Week 8 results are included.
Methodology and limitations
- Population: Dallas’ three most-targeted WRs in each window, all with four appearances in Weeks 1–4 and three in Weeks 5–7. No league qualification threshold or league-rank claim is used.
- Target share: player targets / team targets. Catch rate: receptions / targets. Yards per target: receiving yards / targets. Average target depth: air yards / targets. Per-game values divide by the recorded games in each window.
- Receiving success rate: percentage of targets with positive EPA. First-down rate: percentage of targets producing a first down. YAC/reception: yards after the catch divided by receptions. Rates in the table are pooled period rates, not means of weekly percentages.
- All numerical statistical findings use MCP data. The Week 5 injury context is outside reporting from DallasCowboys.com, explicitly linked above.
- Data Lab and game logs agree on 12 Lamb targets in Week 7; Route IQ reports 11. This analysis consistently uses Data Lab/game-log totals. Some early weekly records, including Pickens’ Week 4 row, carry a partial-data flag; recent core comparison rows do not. Early advanced metrics should be read with that limitation.
- Neither receiver-level defensive assignments nor complete catchable-target samples were established. No causal explanation involving double coverage, scheme, injuries or quarterback accuracy is inferred from these splits.
- Tools: statyx_leaderboard, statyx_player_weekly and statyx_player_game_log. Figures are rounded for display; original research evidence retains additional precision.
Published for research and entertainment purposes. Not betting advice.




Discussion
Sign in to join the discussion.
Loading comments…