Why Anytime Touchdown Props Are So Hard to Beat (And How Statyx's Anytime TD Engine Actually Models Them)
Anytime touchdown scorer props look deceptively simple. Pick a player, bet they find the end zone at some point during the game. But this market carries one of the highest hold percentages in NFL betting, routinely sitting between 20% and 30% across major books. That is not a coincidence. The probl…
 Statyx Staff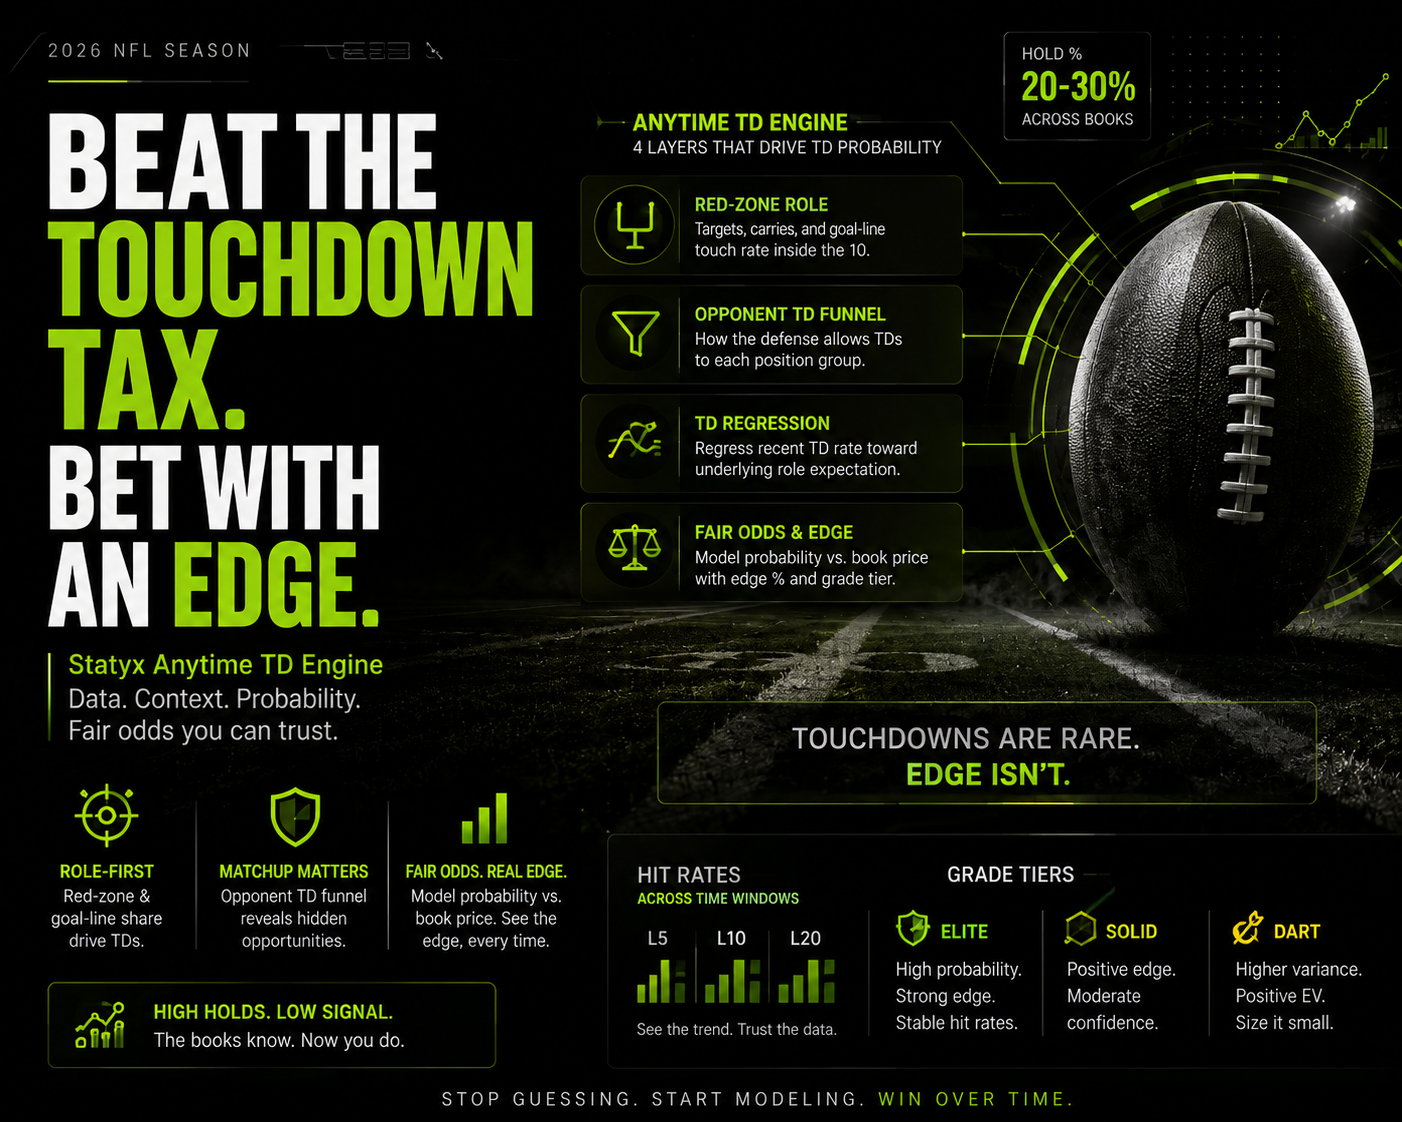
Anytime touchdown scorer props look deceptively simple. Pick a player, bet they find the end zone at some point during the game. But this market carries one of the highest hold percentages in NFL betting, routinely sitting between 20% and 30% across major books. That is not a coincidence.
The problem is structural. Touchdown scoring is noisy, low-frequency, and shaped by factors that standard pregame research barely touches. Most bettors lean on recent box scores, snap counts, and a general sense of a player's role. Sportsbooks price these props knowing exactly how that thinking works, and they build the margin around it.
Beating anytime TD props consistently requires a different kind of model, one that separates signal from noise across multiple layers of context. That is what the Anytime TD Engine at Statyx is built to do.
Why the Market Is Stacked Against You
Touchdowns are rare. A running back who scores 10 times across a 17-game season finds the end zone in roughly 59% of his games. But that rate is not stable from week to week. It shifts based on game script, opponent, field position, and how often the offense actually reaches the red zone. A player can have a strong season-long TD rate and still be a poor bet in a specific game if the matchup is bad and the offense is projected to stall.
Books also shade lines for public perception. Skill players on popular teams get squeezed. A receiver with a big name but a modest red-zone role might be priced at -130 when the fair probability is closer to +100. That gap is where money bleeds out over time.
Most bettors have no clean way to calculate fair probability. They see a player they like, decide the price seems reasonable, and place the bet. The model behind the number stays invisible.
What the Statyx Anytime TD Engine Actually Measures
The Anytime TD Engine is built around four core inputs that together produce a probability estimate and a fair odds comparison against the current book price.
Red-Zone Role and Goal-Line Share
The most predictive factor for anytime TD probability is not overall target share or snap count. It is what happens inside the 20-yard line, and specifically inside the 10.
The engine tracks each player's red-zone target or carry share, their goal-line touch rate, and how that role has trended over recent weeks. A receiver who sees 30% of red-zone targets on a team that reaches the red zone 4.5 times per game has a meaningfully different TD profile than one who sees 10% of those targets on the same offense.
This distinction matters more than most bettors realize. Two players on the same team can have nearly identical snap counts and still carry wildly different anytime TD probabilities based purely on where they are deployed on the field.
Opponent TD Funnel
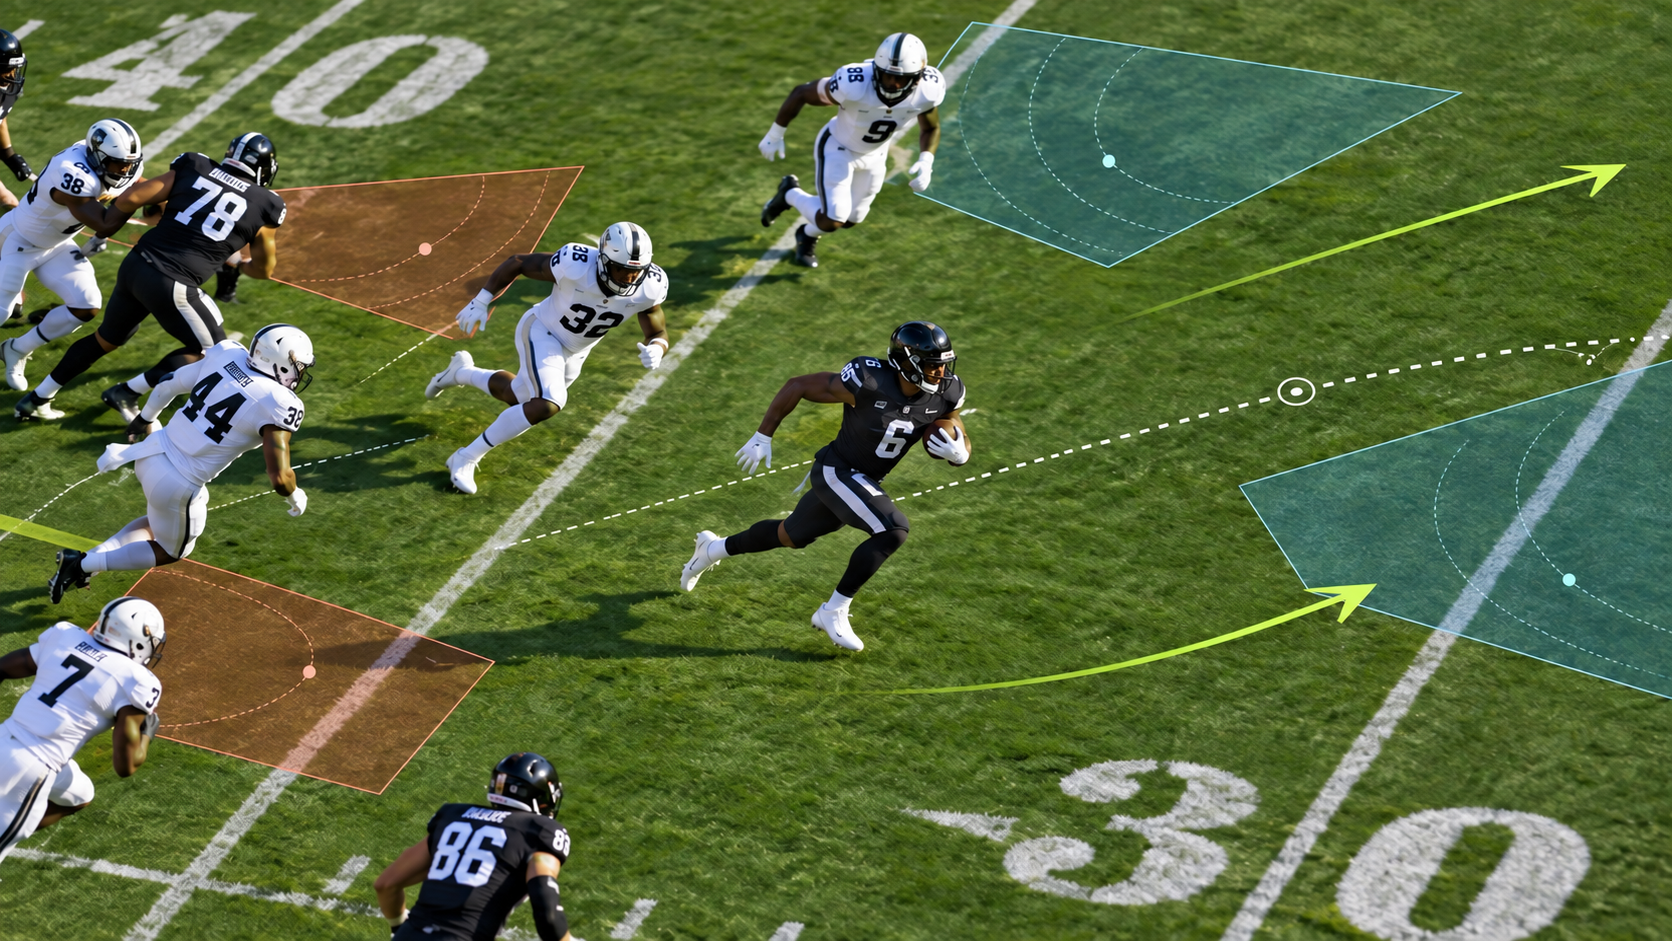
Not all defenses allow touchdowns at the same rate, and not all of them allow them to the same position groups. The engine pulls opponent TD funnel data, which measures how often a defense surrenders touchdowns to running backs, tight ends, and wide receivers specifically, rather than relying on overall defensive rankings.
A defense that sits in the middle of the league overall might be one of the worst in football at stopping goal-line running backs. A defense that looks tough in yards allowed might funnel scoring opportunities toward receivers because of how they play the red zone. These splits are invisible in standard rankings but built directly into the engine's probability output.
TD Regression
Short-term TD rates fluctuate a lot. A player who scores in three straight games is not necessarily 80% likely to score again the following week. The engine applies a regression component that adjusts for the gap between a player's recent TD rate and their underlying role-based expectation.
This keeps the model from overweighting hot streaks or penalizing players too heavily for a cold stretch. If a back has the red-zone role and goal-line share to support a 45% TD probability but has gone three games without scoring, the regression component keeps that estimate grounded in the structural signal rather than the recent noise.
Fair Odds, Edge vs. Book, and Grade Tiers
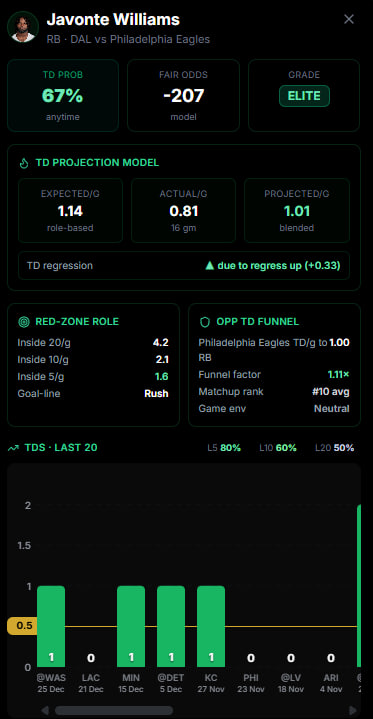
Once the probability is calculated, the engine converts it to fair odds and compares that number against the current book price. The output shows the edge percentage directly, so there is no mental math required to figure out whether a -150 line on a player the model estimates at 42% is actually worth taking.
Hit rates are displayed across the last 5, 10, and 20 games, giving a sense of how stable the probability estimate has been over different time windows. A player with consistent hit rates across all three windows is a different kind of bet than one whose L5 looks strong but whose L20 is mediocre.
Players are graded into three tiers: Elite, Solid, and Dart. Elite grades reflect high probability, meaningful edge, and stable hit rates. Solid grades reflect a positive edge with moderate confidence. Dart grades are lower-probability plays with positive expected value but higher variance, the kind of plays that make sense in small doses within a larger approach.
How to Use This During the 2026 Preseason and Early Season
The 2026 NFL preseason is the right time to build familiarity with the engine before the regular season props market gets fully priced in. Preseason games themselves are not the focus, but the early weeks of the regular season are when role data is freshest and books are still calibrating their lines.
Early in the year, opponent TD funnel data from the prior season carries significant weight because current-season samples are still thin. The engine accounts for this by weighting recent role data more heavily when season-long samples are limited. As the season progresses and current-year data accumulates, the model shifts toward in-season inputs.
The practical implication: the first three to four weeks of the regular season tend to produce the largest edges in anytime TD props. Books are pricing off public perception and limited data. The engine is already incorporating red-zone role and goal-line share from training camp depth charts and early snap data.
What This Changes About Your Research Process
The most common mistake in anytime TD betting is treating it as a one-dimensional decision. Pick a player you think will score, check the price, place the bet. The Statyx Anytime TD Engine pushes toward a more structured approach.
You are looking at role first, not name recognition. You are checking whether the opponent's TD funnel favors the position group. You are comparing fair odds to book odds rather than deciding whether a price feels right. And you are using grade tiers to size your confidence appropriately, rather than treating every play the same.
No model guarantees wins. But this one replaces guesswork with a framework grounded in the actual mechanics of how touchdowns are generated and allowed.
If you want to see how the engine grades specific players heading into the 2026 season, the full Anytime TD Engine is up and running.
Frequently Asked Questions
What is an anytime touchdown scorer prop? An anytime touchdown scorer prop is a bet that a specific player will score at least one touchdown at any point during a game, regardless of whether it comes on a rush, a reception, or another method.
Why do anytime TD props have such high sportsbook holds? Touchdown scoring is a low-frequency, high-variance event. Books build large margins into these props because bettors tend to rely on name recognition and recent performance rather than structural role data, which gives the house a consistent pricing advantage.
What does red-zone role mean in the context of TD probability? Red-zone role refers to a player's share of offensive plays inside the opponent's 20-yard line. Players who receive a high percentage of red-zone targets or carries have a structurally higher probability of scoring than their overall snap count or target share would suggest.
What is TD regression and why does it matter? TD regression adjusts a player's recent scoring rate toward their role-based expectation. It prevents the model from overreacting to short hot or cold streaks and keeps the probability estimate grounded in sustainable structural factors.
What do the Elite, Solid, and Dart grade tiers mean? Elite grades indicate high probability, meaningful edge over the book price, and stable hit rates. Solid grades reflect a positive edge with moderate confidence. Dart grades are lower-probability plays with positive expected value but higher variance, suitable for smaller allocation within a broader approach.
How does the opponent TD funnel differ from standard defensive rankings? Standard defensive rankings measure overall yards or points allowed. The TD funnel specifically measures how often a defense surrenders touchdowns to each position group in the red zone, which can surface mismatches that overall rankings completely obscure.
When is the best time to use the Anytime TD Engine during the NFL season? The early weeks of the regular season tend to show the largest edges because books are still calibrating their lines while the engine is already incorporating red-zone role and goal-line share data from preseason and early-season depth charts.
Published for research and entertainment purposes. Not betting advice.

Discussion
Sign in to join the discussion.
Loading comments…