Positive EV Sports Betting: How to Build a Long Term Prop Strategy Around Edge
Most bettors lose not because they pick bad players, but because they never build a process that generates consistent edge. They chase lines, react to injury news five minutes after everyone else, and dress up gut feel as analysis. Positive EV betting is the opposite of that a disciplined, data dri…
 Statyx io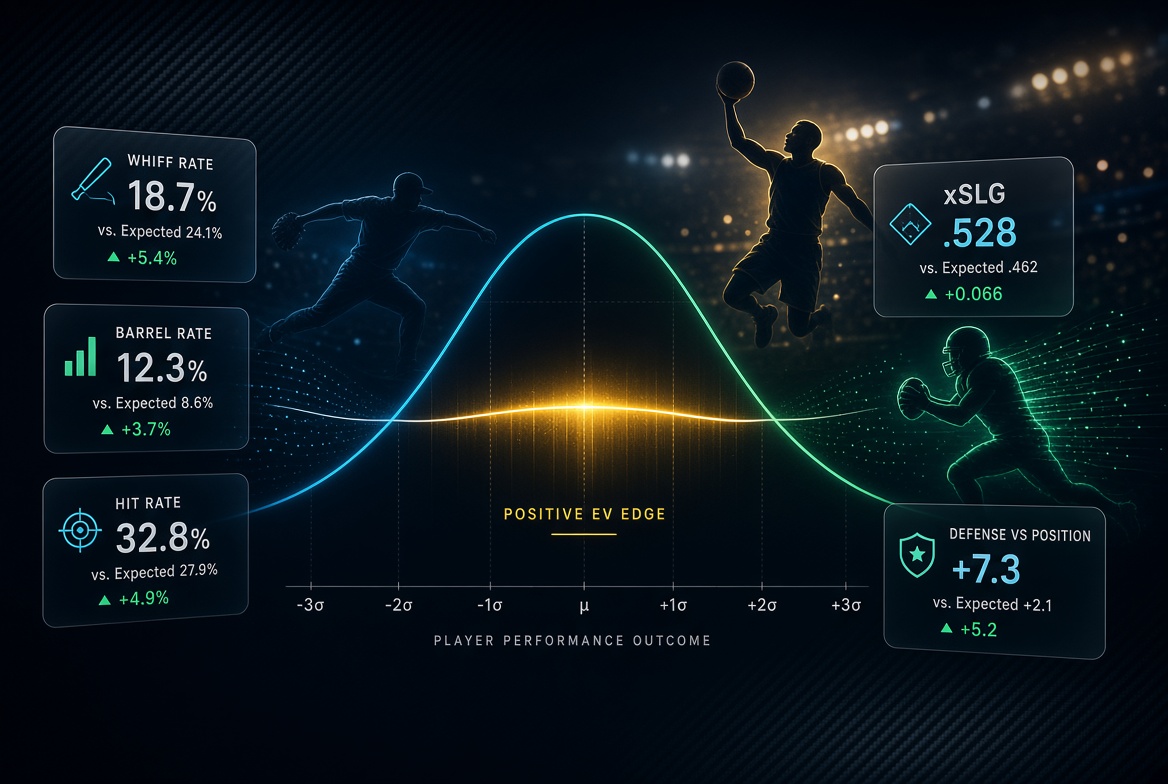
Most bettors lose not because they pick bad players, but because they never build a process that generates consistent edge. They chase lines, react to injury news five minutes after everyone else, and dress up gut feel as analysis. Positive EV betting is the opposite of that a disciplined, data driven approach to finding spots where your probability estimate beats the implied probability baked into the line.
This article breaks down what positive EV actually means in the context of player props, how to identify edge systematically, and how to structure a research process that compounds over time.
What Positive EV Actually Means
Expected value is the mathematical relationship between your estimated probability of an outcome and the price the sportsbook is offering on it.
Say you estimate a pitcher hits the over on 3+ strikeouts 60% of the time, and the book has that priced at -115, an implied probability of roughly 53.5%. That gap between 60% and 53.5% is your edge. Bet into it consistently over a large enough sample, and the math works in your favor.
The key word is estimate. Your probability has to be grounded in something real, not optimism. That's where most bettors fall apart — "I think he goes off tonight" isn't a model, it's a feeling.
Positive EV betting requires three things:
A probability estimate you can defend with data A line that underprices that probability The discipline to bet when the edge is there, and pass when it isn't Why Player Props Are the Best Market for Finding Edge Sportsbooks price player props with less precision than game lines. The sheer volume of available props across MLB, NBA, NFL, and soccer means books can't dedicate sharp attention to every single line — and that creates soft spots.
Props are also more directly tied to matchup-level data. A pitcher's strikeout prop isn't just about his season K rate. It's about his whiff rate against right-handed batters over the last 15 games, the opposing lineup's chase rate, and how the park plays into swinging-strike tendencies. A batter's home run prop depends on exit velocity, barrel rate, launch angle, and whether the opposing starter gives up hard contact to pull-side hitters.
That granularity is where edge lives. The book sets a line based on broad inputs. You find edge by going deeper than their model does.
Building a Research Process That Generates Edge
Start with the Right Metrics Surface level stats don't generate edge. Batting average, points per game, passing yards these are already priced in. Edge comes from metrics that predict future performance more accurately than the market reflects.
For MLB props, that means exit velocity, barrel rate, whiff rate, and chase rate. A pitcher sitting at a 34% whiff rate against a lineup with a 28% chase rate is a fundamentally different prop than his raw K/9 suggests. For NBA props, zone-level shot efficiency and defense vs. position rankings tell you whether a player's scoring line is supported by the matchup or just by his reputation. For NFL, WR/CB matchup data and target share against specific coverage schemes matter far more than raw receiving yard averages.
The research process starts with one question: what metrics actually predict this outcome, and what does the data say about those metrics right now?
Build a Hit Rate Baseline Before you evaluate a specific line, you need to know how often a player has hit comparable props over recent samples. Last 5, 10, and 15 game windows give you a rolling picture of current form not season averages that still include a cold stretch from three months ago.
If a player has hit the over on 2+ assists in 9 of his last 10 games, that matters. It tells you the prop is achievable at his current pace. Layer in a matchup where the opposing defense ranks in the bottom third against point guards, and you have a defensible edge case.
Hit rate alone isn't edge. Hit rate plus matchup context is.
Evaluate the Matchup Specifically Generic form analysis misses the most important variable: who is the player actually facing tonight? A batter with a .420 xSLG against fastball heavy pitchers looks very different when he's facing a guy who throws 65% four seamers versus a ground ball pitcher with a 12% barrel against rate.
This is where most free tools fall short. They show you the player's history. They don't show you the specific defensive or pitching context that determines whether tonight is a high-probability spot.
Defense vs. position rankings, WR/CB matchup data, and pitcher batter splits are what separate a real research process from an educated guess.
Estimate Your Probability, Then Compare to the Line Once you have the relevant metrics, assign a probability to the outcome. This doesn't need to be a precise model it needs to be grounded in the data you have.
If the hit rate over the last 10 games is 70%, the matchup is favorable, and the trend is positive, you might land at 65% probability. If the book has the line at -130 (implied probability of roughly 56.5%), that's a positive EV bet. If the book has it at -160 (implied probability of roughly 61.5%), you pass. The edge isn't there.
This is where discipline matters most. Positive EV betting isn't about backing your favorite players — it's about betting when the price is right.
The Discipline Problem: Why Most Bettors Fail at EV-Based Strategies
Understanding positive EV and actually executing it consistently are two different things. The most common failure modes:
Chasing losses. Lose three straight bets that were genuinely positive EV and the temptation is to increase size or start taking lower confidence spots to get back to even. That destroys the edge you built.
Ignoring bankroll management. Flat betting a consistent unit size typically 1–3% of bankroll per bet keeps variance from ending your strategy during a cold run. Overbetting good spots amplifies variance beyond what the edge can absorb.
Confusing confidence with edge. A high conviction bet isn't automatically positive EV. If the book has already priced in the same information you have, there's no edge regardless of how certain you feel.
Not tracking results. Without a record of your bets, you can't know whether your process is generating real edge or whether you've just been running hot. Logging every bet the line, your estimated probability, and the outcome is the only way to evaluate your process honestly.
How Data Tools Fit Into a Positive EV Process
Free tools show you what happened. A platform built for serious prop research shows you what's likely to happen next.
The difference is depth and context. Baseball Savant gives you exit velocity data. But it doesn't put that data next to the opposing pitcher's barrel against rate, the player's last 15 game trend, and an AI generated probability estimate for tonight's HR prop all in one place. That consolidation matters when you're researching six props before a 7pm slate.
Statyx is built specifically for this workflow. The MLB HR Engine and K Engine surface exit velocity, barrel rates, whiff rates, and chase rates for both batter and pitcher props. NBA Shot Charts include zone level data with quarter filters and defense vs. position rankings across all five positions. Player Performance Boards display last 5, 10, and 15 game averages alongside hit rate trend indicators. An AI layer sits on top of the raw data tables and generates contextual probability estimates for prop outcomes so you're not doing the synthesis manually across a dozen browser tabs.
The research process described in this article, from metric selection to matchup analysis to probability estimation, runs faster when the data is already consolidated and the AI has flagged the relevant context.
> What a Repeatable Edge Building Process Looks Like
A sustainable positive EV prop strategy isn't complicated. It's consistent. Here's a practical structure:
-Identify the slate. Which games have the most prop volume and the most data to work with?
-Screen by matchup quality. Which players face matchups where the relevant metrics point in one direction?
-Pull recent hit rates. Does the player's last 10–15 game trend support the prop line?
-Estimate probability. Based on the metrics and matchup, what's your honest number?
-Compare to the line. Is the book underpricing your estimate? If yes, bet. If no, pass.
-Record the bet. Log the line, your estimated probability, and the outcome.
-Review weekly. Are your estimates calibrated? Where is your actual edge coming from?
-The review step is what most bettors skip. It's also where you find out whether you have a process or just a habit.
FAQs
What does positive EV mean in sports betting? Positive EV means your estimated probability of an outcome is higher than the implied probability reflected in the sportsbook's line. Over a large sample of positive EV bets, you expect to profit even when individual bets lose.
How do I calculate expected value on a player prop? Convert the sportsbook odds to implied probability. Estimate your own probability for the outcome using the relevant data. If your estimate exceeds the implied probability, the bet has positive EV. The size of that gap determines how much edge you have.
Why are player props better for finding positive EV than game lines? Books price game lines with more precision because they attract more sharp action. Player props especially in high volume markets like MLB and NBA — have more soft spots because the sheer number of available lines makes it harder to price every one precisely.
What metrics matter most for MLB player prop research? For batter props, exit velocity, barrel rate, and launch angle are the most predictive for HR and extra-base hit props. For pitcher strikeout props, whiff rate and the opposing lineup's chase rate are the most relevant inputs.
How many games of data should I use when evaluating a player prop? Last 10 to 15 games typically gives you a meaningful sample that reflects current form without being distorted by a single outlier. Season-long averages can mask recent trends, especially after lineup changes, injury returns, or role shifts.
Do I need to build a formal model to bet positive EV? No. A structured research process using the right metrics and a disciplined probability estimation habit is sufficient. Formal models help at scale, but most serious prop bettors generate edge through consistent matchup analysis and honest probability assessment rather than complex algorithms.
How do I know if my process is actually generating edge? Track every bet with the line, your estimated probability, and the result. After 100 or more bets, compare your actual win rate to your estimated win rate. If your estimates are calibrated and your win rate aligns with your implied edge, the process is working.
Build the Process, Then Repeat It
Positive EV sports betting isn't a shortcut. It's a process that rewards consistency, data discipline, and honest self-assessment. The bettors who build long-term profitability aren't the ones with the hottest tips they're the ones who research every spot the same way, pass when the edge isn't there, and track everything.
The data side of that process is where Statyx fits. Start your 3-day free trial, no commitment, full access.
Published for research and entertainment purposes. Not betting advice.

Discussion
Sign in to join the discussion.
Loading comments…