New Soccer Season, Sharper Reads: How Statyx's Fixture-Level Props Suite Preps You for Every Kickoff
The whistle blows. The season is back. Domestic leagues are resuming across the calendar, and with them comes the full slate of player props, team totals, and fixture markets that make soccer one of the most rewarding sports to research. The problem most bettors run into at the start of a new seaso…
 Statyx Staff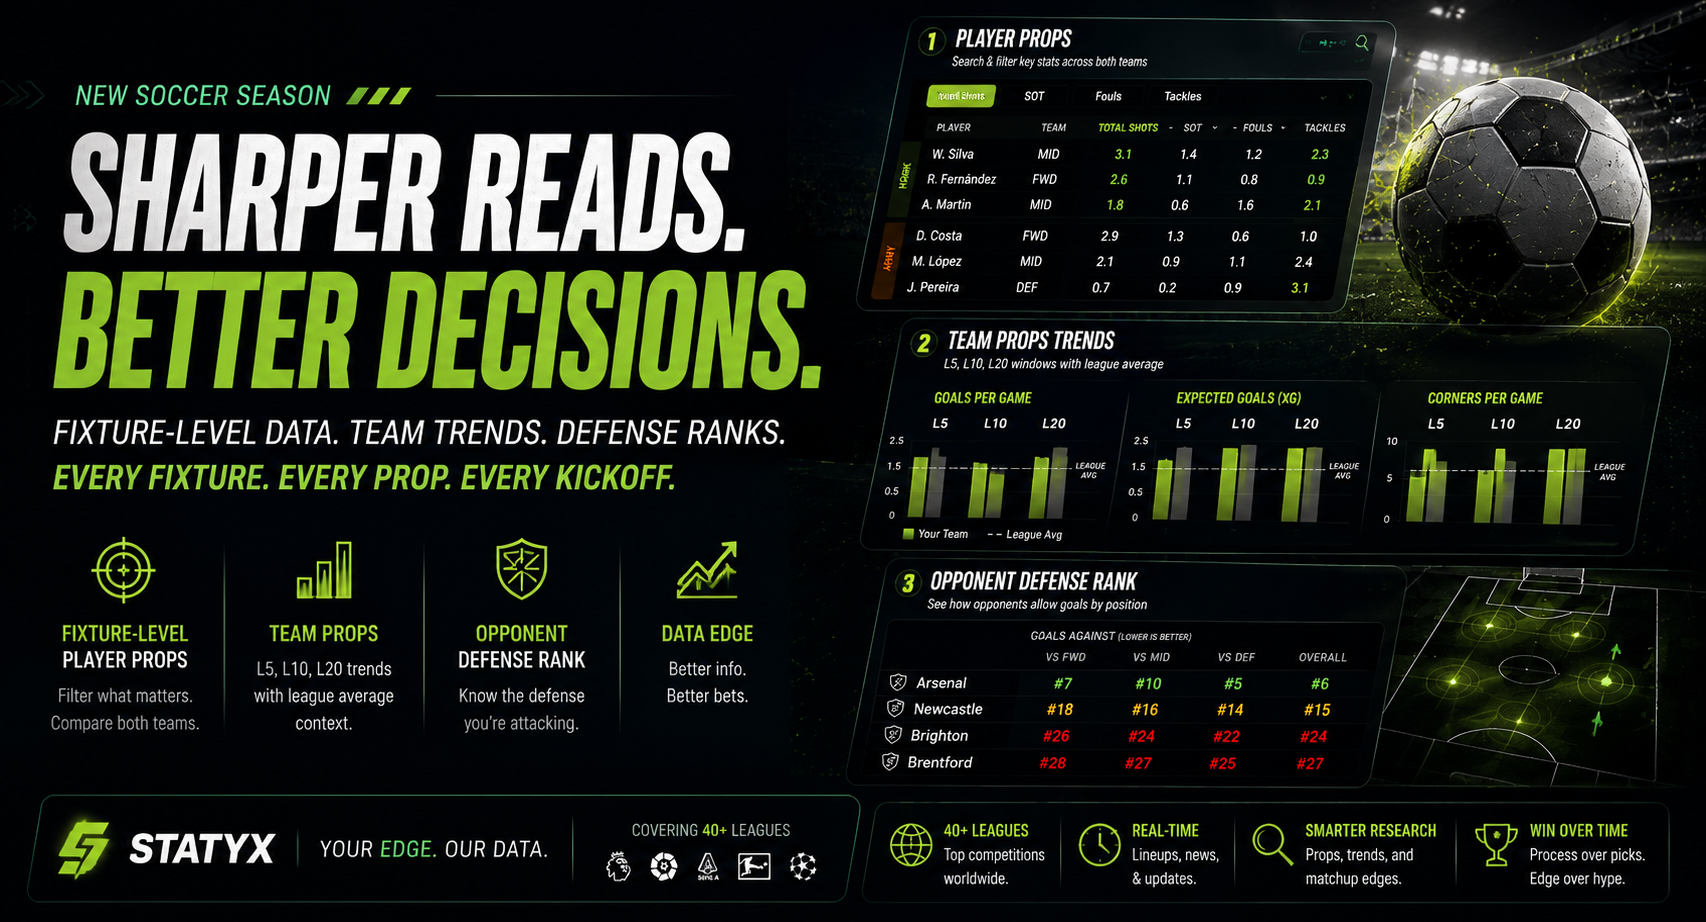
The whistle blows. The season is back.
Domestic leagues are resuming across the calendar, and with them comes the full slate of player props, team totals, and fixture markets that make soccer one of the most rewarding sports to research. The problem most bettors run into at the start of a new season isn't a lack of interest. It's a lack of structure. Fresh squads, new managers, rotated roles, and early-season variance can make even well-reasoned reads feel shaky.
That's where having the right analytical framework matters. Statyx built its soccer suite specifically around fixture-level research, giving you layered tools to evaluate individual players, team tendencies, and opponent defensive quality before every kickoff.
Here's what those tools look like in practice, and why they matter more right now than at any other point in the season.
Fixture-Level Player Props: Filter What Actually Matters
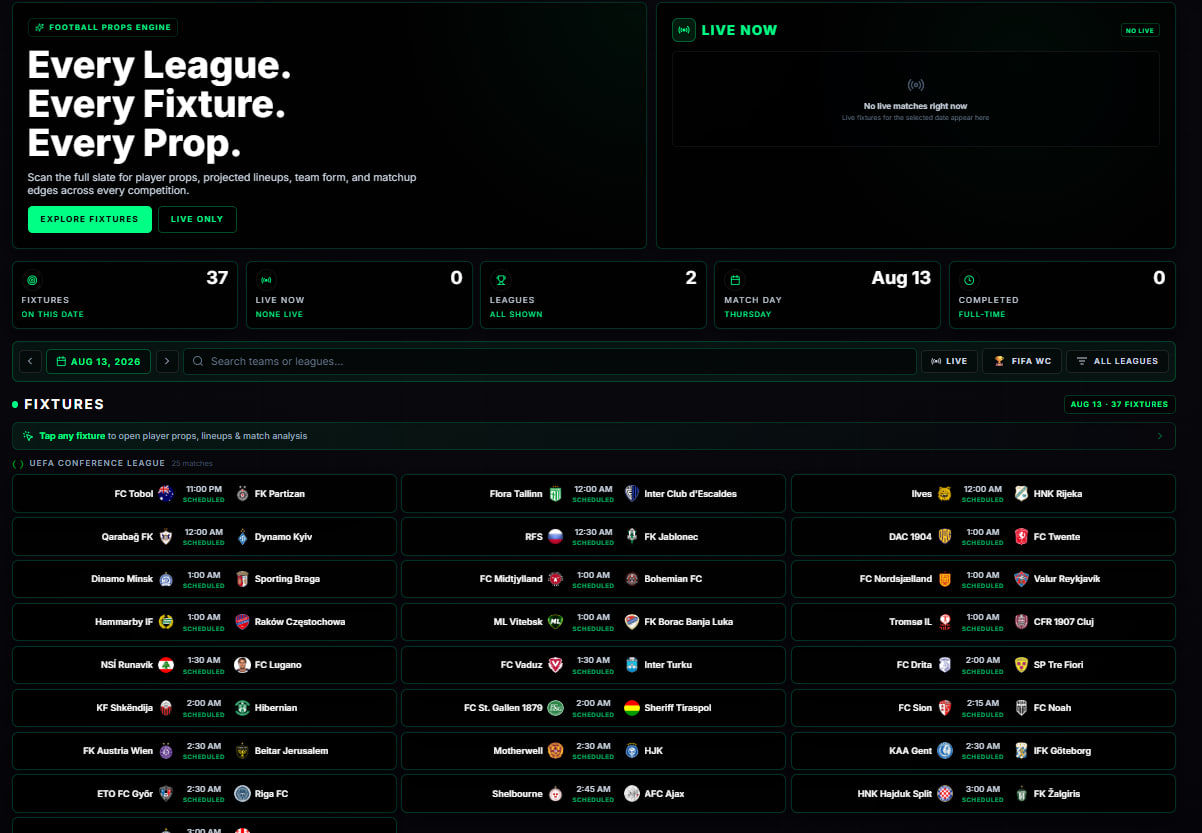
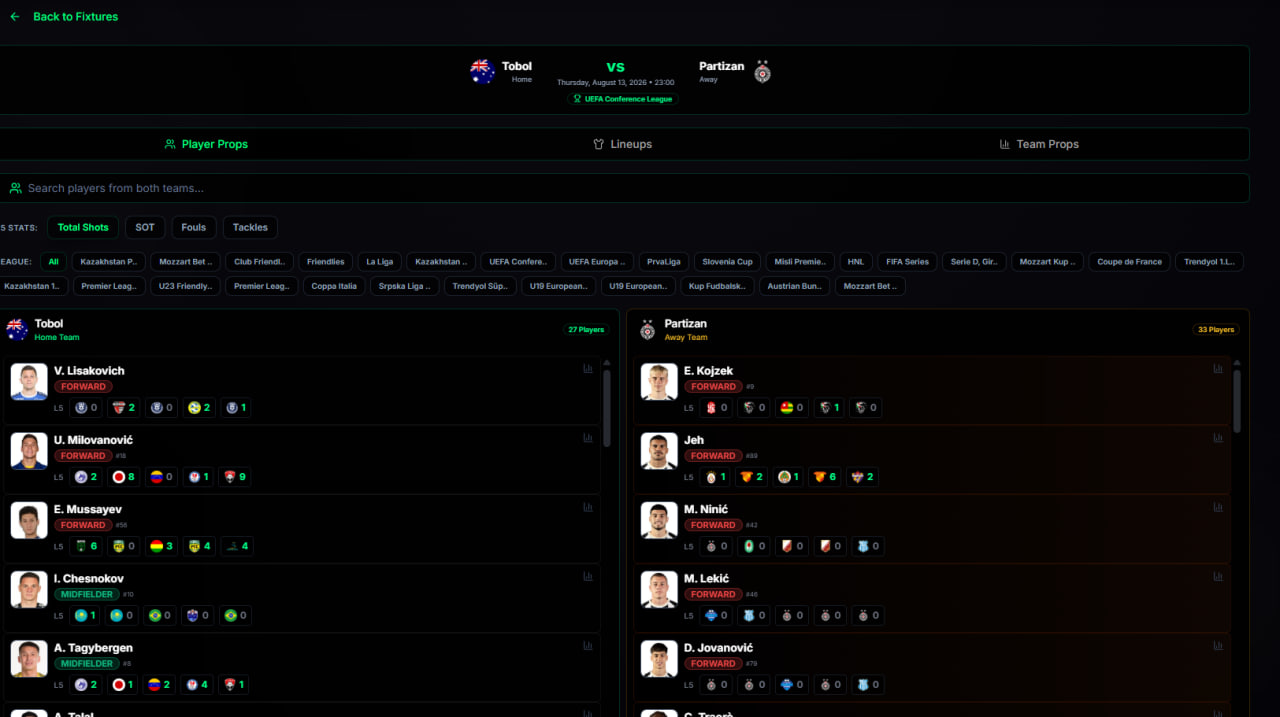
The foundation of Statyx's soccer offering is the fixture-level Player Props module. Rather than browsing season averages in isolation, you can pull up any upcoming fixture and immediately filter player data across both squads by the stats that drive prop markets.
The available filters cover Total Shots, Shots on Target (SOT), Fouls, and Tackles. Each maps directly to common prop bet types, and having them searchable across both teams in a single fixture view saves the kind of time that usually gets burned toggling between separate data sources.
Why Fixture-Level Framing Changes the Research Process
Season averages are a starting point, not a conclusion. A winger who averages 2.4 shots per game might produce very differently against a deep defensive block than against a high-press side that concedes space in behind. Fixture-level framing keeps that context front and center.
When you filter by Total Shots across both teams in a fixture, you're not just identifying who shoots a lot. You're building a picture of how the game is likely to flow, which players are positioned to get into shooting situations, and where the volume is concentrated. The same logic applies to Fouls and Tackles. A midfielder who racks up fouls against physical opponents gives you a different read on card props than one whose foul totals spike only in high-pressure away games.
The ability to search these filters across both squads simultaneously is a detail that matters. Prop research isn't one-sided. Understanding what the opposing team's players tend to do in similar fixtures shapes your read on the whole market.
Team Props: L5, L10, L20 Trend Charts With League Average Context
Individual player props don't exist in a vacuum. Team-level tendencies set the table for almost every player outcome, and Statyx's Team Props module gives you a structured way to evaluate those tendencies across meaningful sample windows.
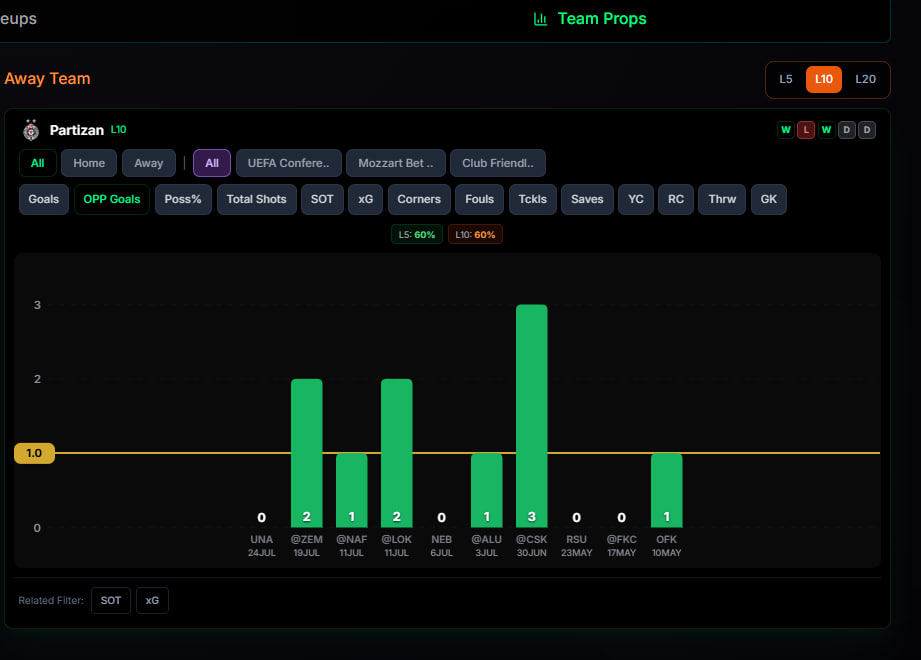
The module displays bar charts for Goals, Expected Goals (xG), and Corners across three rolling windows: the last 5 fixtures (L5), last 10 (L10), and last 20 (L20). Each chart includes a league average line, which is what separates a useful trend chart from a decorative one.
Reading the Windows Together
The three-window structure is intentional. L5 captures recent form, which is what most casual bettors look at. L10 gives you a medium-term picture that smooths out one or two outlier results. L20 approaches something closer to a true seasonal baseline.
When all three windows tell the same story, you have a consistent team identity. A side sitting above the league average line for xG across L5, L10, and L20 is generating quality chances at a reliable rate, not just running hot over a short stretch.
The more interesting reads come when the windows diverge. A team with a low L5 but a strong L20 might be in a temporary dip, still capable of producing against the right opponent. A team whose L5 has spiked well above their L10 and L20 might be overperforming recent expectations, with regression a real possibility.
Corners are worth particular attention here. Corner markets are among the most stable soccer props, and teams with consistent corner generation tendencies visible across the L10 and L20 bars relative to the league average line give you a cleaner edge than trying to predict goal outcomes in low-scoring, high-variance fixtures.
Opponent Defense Rank: Sizing Up the Defense You're Attacking
The third pillar of Statyx's soccer suite is the per-player Opponent Defense Rank table. It ranks opponent defenses by goals allowed per game, giving you a direct measure of defensive quality that you can apply to individual player prop decisions.
This is the kind of context that changes a read entirely.
A striker averaging 1.8 shots on target per game looks different when their upcoming opponent ranks in the bottom third of the league for goals allowed per game. The same striker looks different again when that opponent ranks near the top defensively. The raw shot average doesn't change. The expected output in this specific fixture does.
How Defense Rank Ties Back to Player Props
The Opponent Defense Rank table is most useful when you cross-reference it with the individual stat filters in the Player Props module. If you're evaluating a shots prop for a forward, you want to know both how often that player shoots and how often the opposing defense allows shots and goals.
Defenses that concede frequently tend to do so in specific ways. Some leak goals from set pieces. Some are vulnerable to quick transitions. Some struggle against width. Goals allowed per game is a summary metric, but it points you toward the right questions about how a player's style matches up against a specific defensive shape.
That matchup layer is where sharper reads come from. It's also what separates fixture-level research from simply checking a player's recent form and calling it done.
Putting It Together Before Kickoff
The three tools work best as a sequence rather than in isolation.
Start with the Team Props charts. Understand how both sides have been generating and conceding chances across the L5, L10, and L20 windows relative to the league average. This sets the context for the fixture as a whole.
Move to the fixture-level Player Props filters. Identify which players on both sides have the stat profiles relevant to the props you're evaluating, whether that's shots, shots on target, fouls, or tackles.
Finish with the Opponent Defense Rank table. Check where each team's defense sits in the league rankings for goals allowed per game, and factor that into your read on whether a player's typical output is likely to hold or shift in this specific matchup.
That sequence turns a loose hunch into a structured, evidence-backed read. It doesn't guarantee outcomes. No tool does. But it gives you a repeatable process that holds up across every fixture on the slate, from opening weekend through the final matchday.
The start of a new season is one of the best times to build better research habits. The slate is full, the markets are open, and teams are still establishing their identities for the year. Getting your analytical framework right now pays dividends across the entire campaign.
Frequently Asked Questions
What soccer stats can I filter in Statyx's Player Props module? The fixture-level Player Props module lets you filter by Total Shots, Shots on Target, Fouls, and Tackles. You can search these filters across both teams in any upcoming fixture simultaneously.
What are the L5, L10, and L20 windows in the Team Props charts? These represent rolling windows of the last 5, 10, and 20 fixtures respectively. Viewing all three together helps you distinguish between short-term form and more stable team tendencies. Each chart also includes a league average line for comparison.
Which team metrics are covered in the Team Props bar charts? The Team Props module covers Goals, Expected Goals (xG), and Corners, with bar charts displayed across the L5, L10, and L20 windows alongside the relevant league average line.
How does the Opponent Defense Rank table work? The table ranks opponent defenses by goals allowed per game, giving you a per-player view of the defensive quality your selected player will face in an upcoming fixture. It helps contextualize individual stat averages against the specific matchup.
Why does fixture-level framing matter more than season averages alone? Season averages smooth out context that actually affects outcomes. A player's shot volume, foul rate, or tackle numbers can shift meaningfully depending on the opponent's defensive style, game state, and tactical setup. Fixture-level research keeps that context visible.
Can I use the soccer tools for both player props and team total markets? Yes. The Player Props module with its stat filters is built for individual player prop research, while the Team Props bar charts are designed to inform team total and team-level markets like corners and goals.
When is the best time to use these tools in the research process? Starting with the Team Props charts to understand fixture context, then moving to Player Props filters, and finishing with the Opponent Defense Rank table gives you a structured sequence that works for any fixture on the slate.
Published for research and entertainment purposes. Not betting advice.

Discussion
Sign in to join the discussion.
Loading comments…